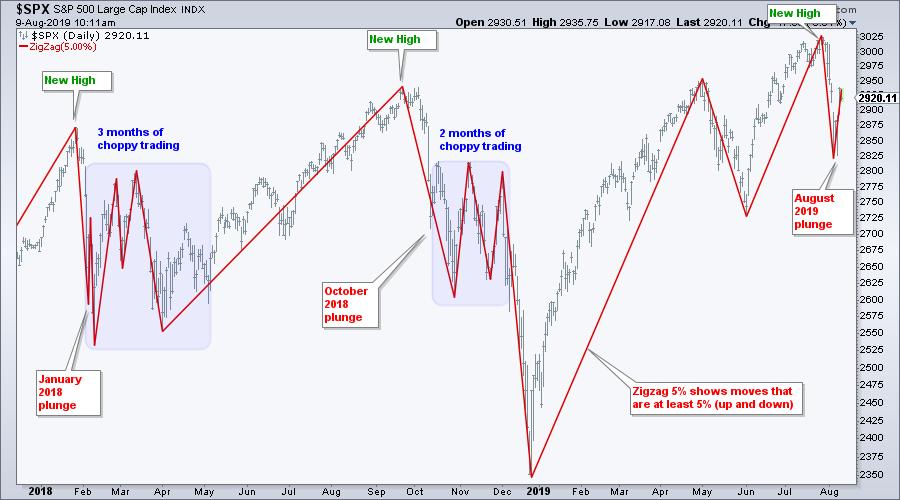
 Volatility reared its ugly head this week with the S&P 500 falling around 6% in six days and then rebounding with a sharp three-day bounce. This is the biggest decline since the May-June correction, and the sharpest decline since early December. Looking back, the S&P 500 advanced throughout 2017 and did not experience a correction of more than 4%. Those were the salad days! 2018 made up for this correction hiatus with seven declines of 5% or more. The sharpness of the current decline is a concern because a sharp decline in January 2018 led to three months of choppy trading and a sharp decline in October 2018 led to two months of choppy trading. Both of these plunges started from new highs, as did the August plunge.
------------------------------------------------------------
Weekly Chart for Perspective
Let's start with a weekly SPY chart for some perspective. The bears will no doubt see a big broadening formation, a failure at the blue trend line extending up from January 2018 and support break with last week's decline below 295. The bulls will counter that SPY hit a new high less than three weeks ago, the ETF is above its rising 40-week SMA and the PPO(4,40,0) remains positive.
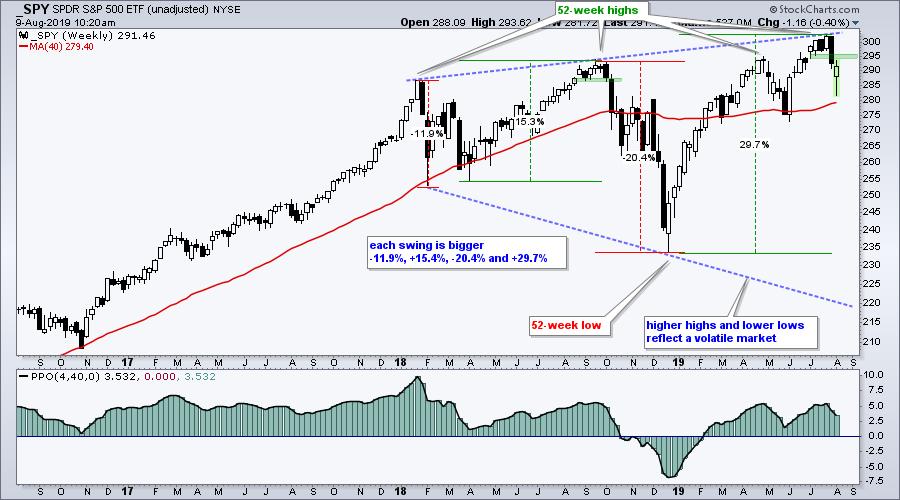
At this point, I think the bearish argument refers to a future possibility, while the bullish argument focuses on the current situation. As a trend-follower and Dow Theory guy who looks at the weight of the current evidence, I side with the current situation. Despite a short-term support break and an increase in volatility, the uptrend in SPY remains in force and has yet to be proven otherwise.
Keep in mind that broadening formations are extremely rare. Furthermore, I doubt if there are enough examples for an objective and quantifiable assessment. I would also venture to guess that most do not play out according to the text books. As far as I am concerned, the up swing or uptrend from late December to late July holds the key. The broadening formation, with its widening swings, 52-week highs and 52-week low, simply reflects a volatile market the last 18 months.
------------------------------------------------------------
Daily Chart for Trend Monitoring
The daily chart captures the current uptrend. In addition to a new high less than three weeks ago, the index is above the rising 200-day SMA and the 20-day SMA is above the 200-day SMA. The lows from March to June mark a clear support zone to watch going forward. A break below the 200-day and this support zone would call for a reassessment or the current uptrend.
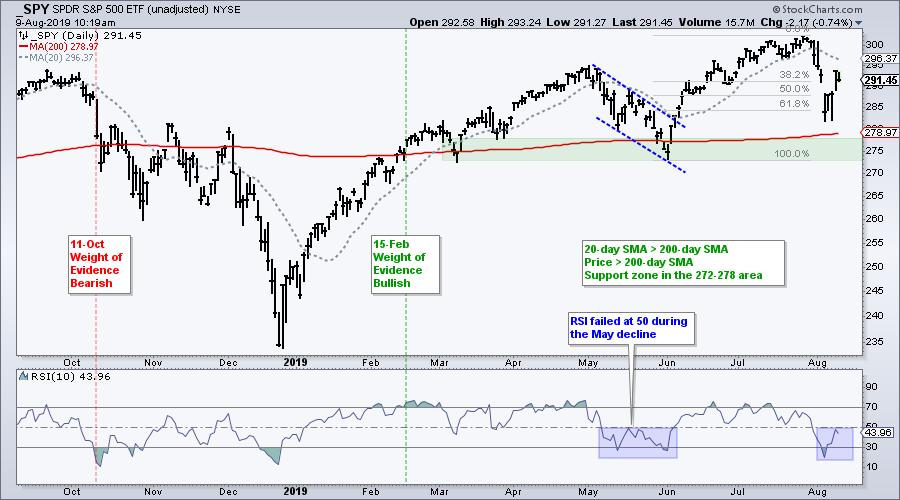
Short-term, SPY plunged below 285 on Monday and then rebounded with a surge above 293. As noted on Tuesday, the index was ripe for a mean-reversion bounce because several indicators were oversold and the 61.8% retracement was at hand. We got that bounce and now is the time for mean-reversion traders to think about exit strategies.
------------------------------------------------------------
State of the Markets Video
------------------------------------------------------------
Index Breadth Model
There were two new signals on the index breadth model this week. The 10-day EMA of S&P 500 AD Percent ($SPXADP) plunged below -30% on Monday for a bearish breadth thrust and the Mid-Cap %Above 200-day EMA (!GT200MID) moved below 40% to reverse its bullish signal. The S&P 500 and S&P Mid-Cap 400 remain net bullish with two of the three indicators still on active bullish signals, but the S&P Small-Cap 600 remains net bearish. Overall, five of the nine indicators are on active bullish signals and this means the weight of the evidence remains bullish.
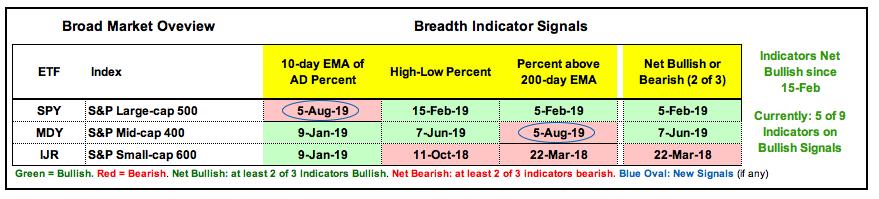
You can learn more about these indicators with the following links: AD Percent (here), High-Low Percent (here), %Above 200-day EMA (here) and YouTube video covers all three (here).
------------------------------------------------------------
Bottom Line
The weight of the evidence remains bullish for stocks, but selectivity is the name of the game. The index and sector breadth models are net bullish, and S&P 500 SPDR remains in an uptrend overall. Small-caps continue to lag, but this has been the case for at least nine months. SPY, QQQ, XLY, XLK, XLRE, XLU and XLP were NOT affected by relative weakness in small-caps and hit new highs this summer. Volatility remains high over the last 18 months and it is picking up here in August. With September and October just around the corner, we could be in for a rocky ride. I will not, however, turn bearish until the evidence tells me to do so. Even so, keep in mind that stocks are up sharply since late December and a corrective period that last a few months would not be abnormal.
------------------------------------------------------------
IWM is the Weakest Link
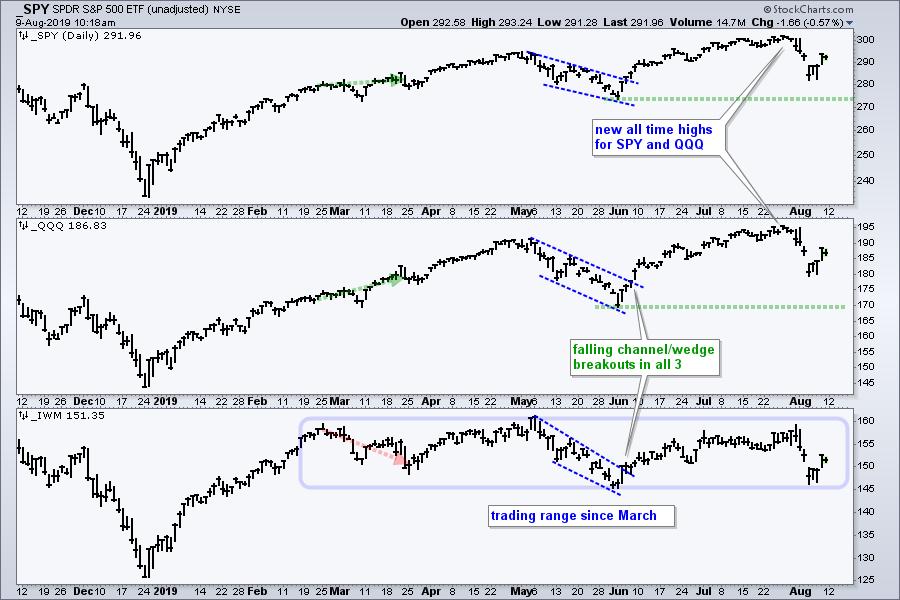
The chart below shows SPY and QQQ hitting new highs in late July and remaining above their early June lows with the early August decline. These two are still in clear and present uptrends. IWM, in contrast, remains range bound since March and bounced off the early June low this week. One of these ETFs (IWM) is not like the others.
------------------------------------------------------------
Sector Breadth Model
There were two new signals on the sector breadth table this week as the 10-day EMAs for XLF AD Percent ($XLFADP) and XLE AD Percent ($XLEADP) moved below -30% for bearish breath thrusts. Energy has been net bearish since May 1st so this signal does not change anything. The High-Low Percent and %Above 200-day EMA indicators remain bullish for the other sectors and the table as a whole supports the bull market with a signal weight at +69%. It will take more than a two week decline to derail the bull market.
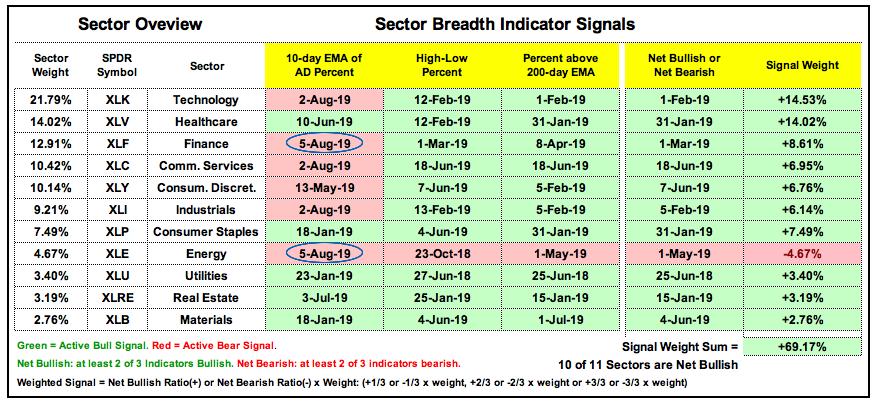
Of note, the Health Care SPDR (XLV) held up the best of the biggest six sectors this past week. Why? Because a bearish breadth thrust did NOT trigger and all three indicators remain on active bullish signals. XLI High-Low% ($XLIHLP) hit +10.29% on Thursday and this was the most of the big sectors. XLE High-Low% ($XLEHLP) hit -34.5% on Wednesday and this sector has the most new lows by far. XLU High-Low% ($XLUHLP) and XLRE High-Low% ($XLREHLP) hit +28.12% and +39.29% on Thursday and these sectors have the most new highs (as a percentage of total issues in the sector).
------------------------------------------------------------
Focus on the Big 6
The next charts focus on the big 6 because they are key influencers when it comes to the S&P 500. These six biggest sectors account for around 78% of the index. The red lines mark the spring highs (late April and/or early May) and the green lines mark the summer lows (late May and/or early June). These are my benchmark peaks and troughs to measure relative chart performance. First, notice that XLV is the only one trading back above the May high. XLV also held the late May low so it is showing some chart strength the last few months. Overall, the ETF remains in a big narrowing consolidation.
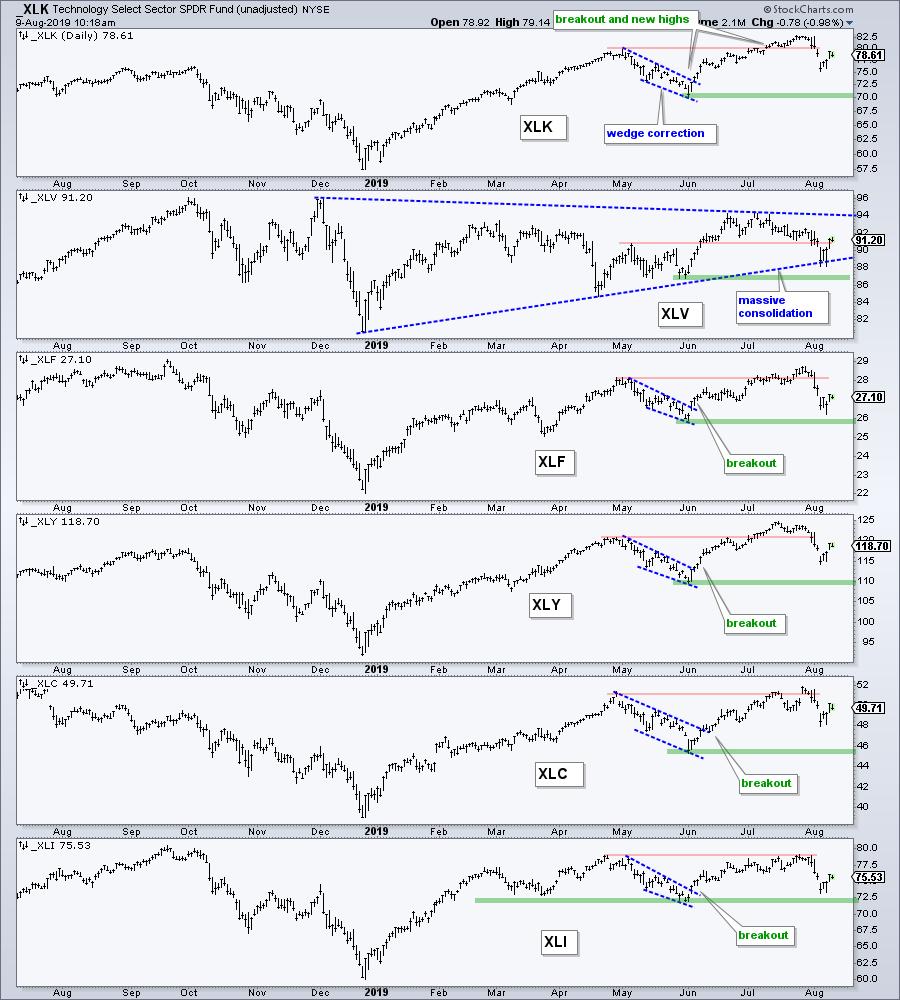
XLK, XLY, XLC and XLF exceeded their May highs and then fell back in August, but held well above the August lows. These three are still in uptrends overall with the August lows marking first support going forward. XLI did not exceed its spring high and came close to the summer low. This ETF has been largely range bounce since March.
------------------------------------------------------------
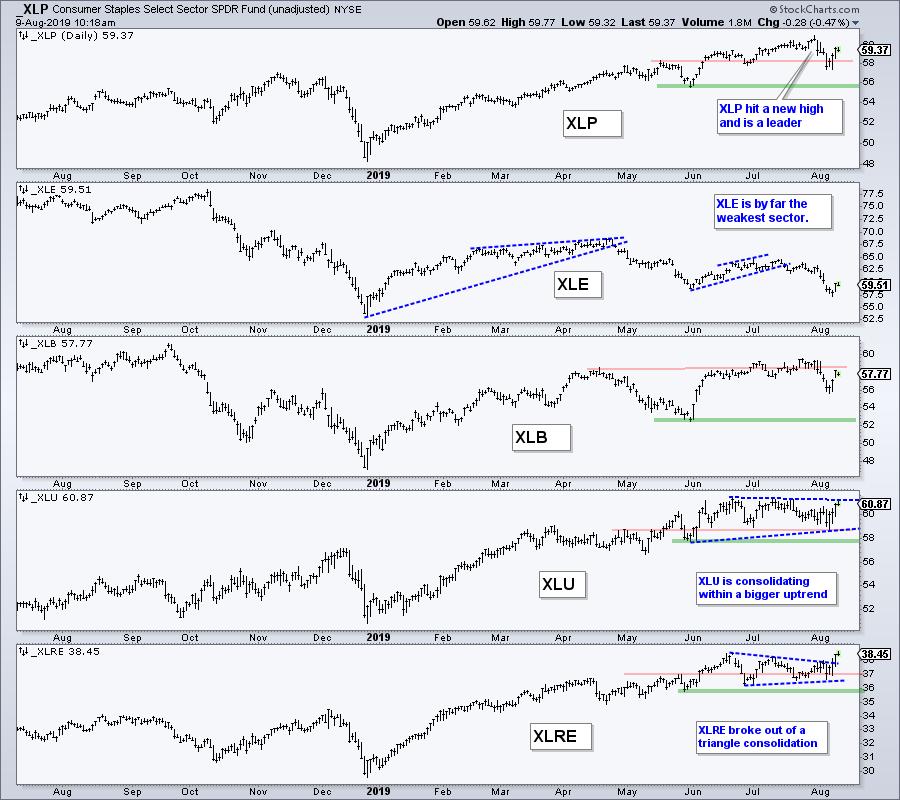
3 of the Little 5 are Leading
The next chart shows the five smallest sector. Again, the red lines mark the spring highs (late April/early May) and the green lines mark the summer lows (late May/early June). Notice that XLP, XLU and XLRE are above both lines. XLP hit a new high in late July, while XLU and XLRE hit new highs in June. As far as I am concerned, these three are the clear chart leaders right now.
------------------------------------------------------------
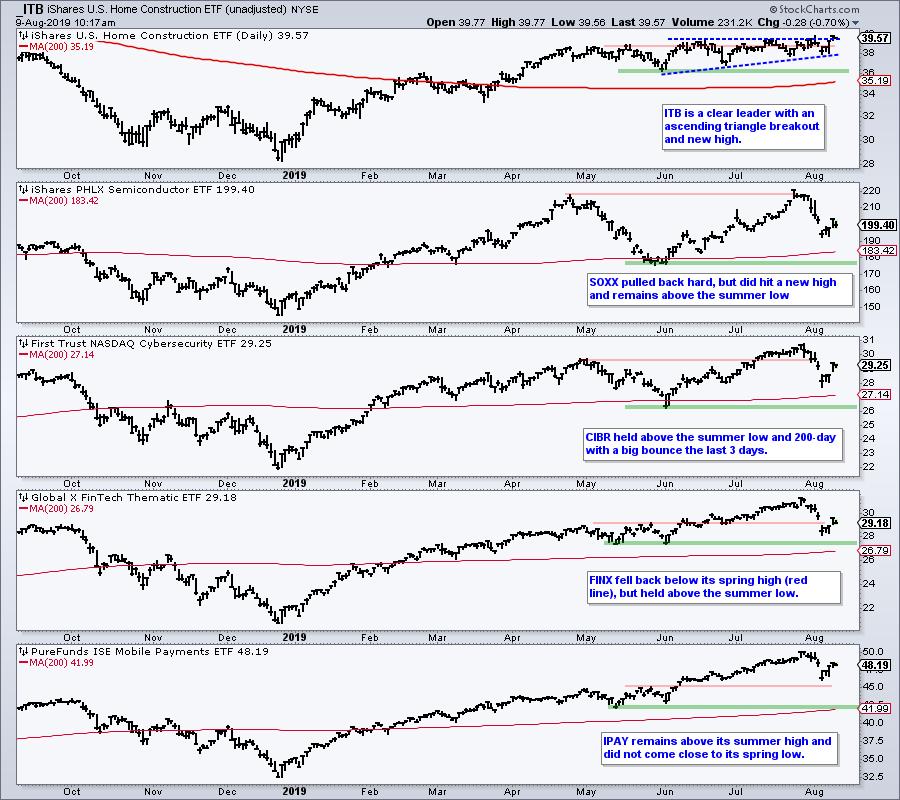
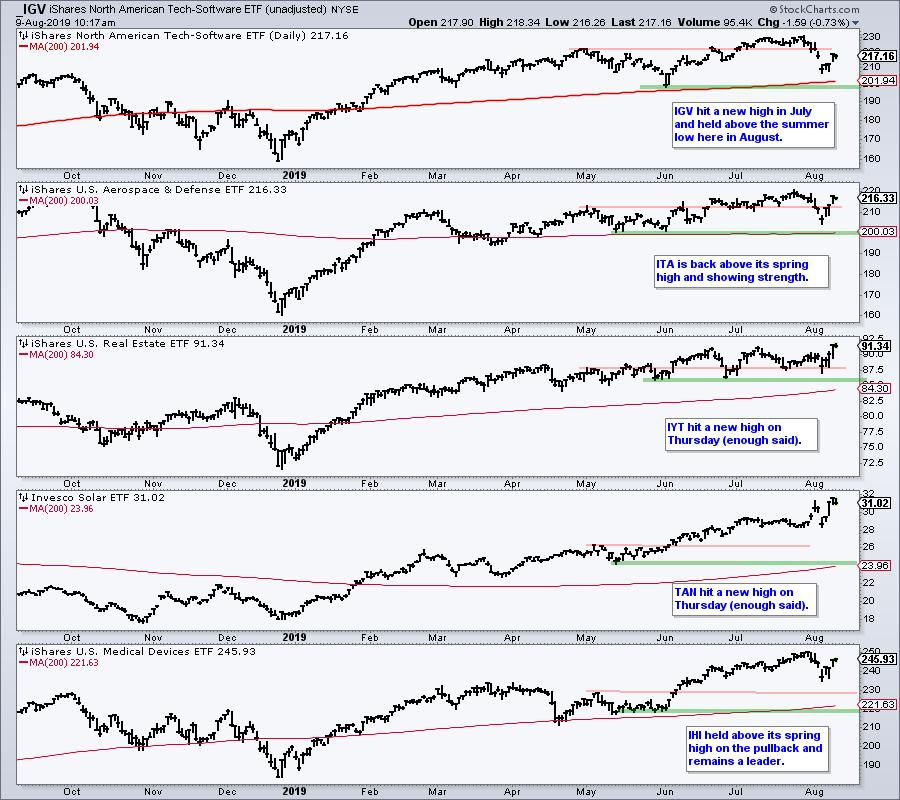
Top Ten Industry Group ETFs
Stocks and ETFs that broke the summer lows in late May/early June did not hold up well during the recent decline. The Bank SPDR (KBE), the Regional Bank SPDR (KRE) and the Retail SPDR (XRT), for example, dipped below their early June lows this week. All three are also below their falling 200-day SMAs. I am not even going to show their charts because they are not in uptrends and they are showing relative weakness.
In contrast, The Home Construction iShares (ITB), Semiconductor iShares (SOXX), Software iShares (IGV), Cybersecurity ETF (CIBR), Fintech Thematic ETF (FINX), Mobile Payments ETF (IPAY), Aerospace & Defense iShares (ITA), REIT iShares (IYR), Solar Energy ETF (TAN) and Medical Devices ETF (IHI) did hold above their summer lows. Seven of these ten hit new highs in July and three hit new highs this week (ITB, TAN and IYR). Talk about strength in the face of a market dip.
------------------------------------------------------------
Choose a Strategy, Develop a Plan and Follow a Process
Arthur Hill, CMT
Chief Technical Strategist, TrendInvestorPro.com
Author, Define the Trend and Trade the Trend
Want to stay up to date with Arthur's latest market insights?
– Follow @ArthurHill on Twitter
