
As noted in Tuesday's commentary, the S&P 500 SPDR (SPY) and several big sector SPDRs remain locked in trading ranges. SPY fell back from range resistance with a modest decline on Tuesday (-.58%). It certainly could have been worst.
As the chart below shows, SPY is caught between a rock (the 200-day SMA) and a hard place (50-day SMA), not to mention support from the August lows and resistance from the August highs. The bigger trend is still up because the ETF hit a new high in July and never even touched its rising 200-day SMA in August.
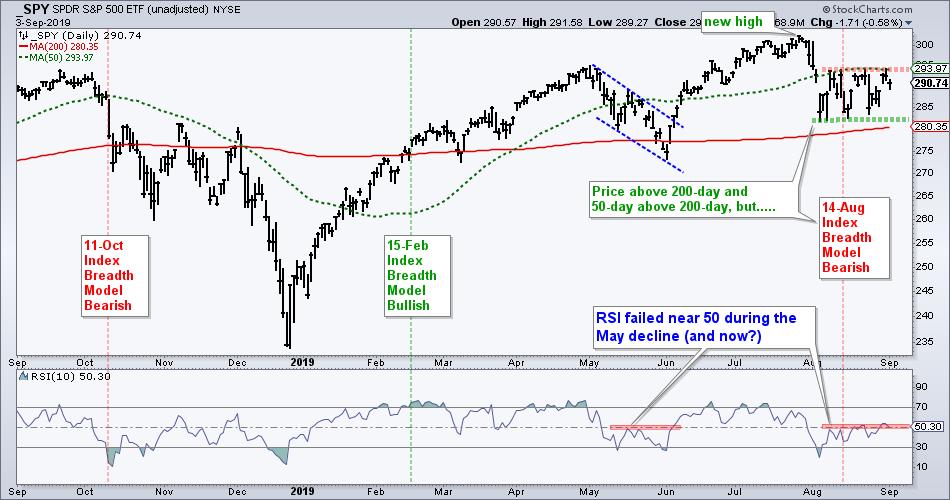
The world is still waiting for the range break, which will no doubt be touted on every blog and news outlet. The cynic in me wonders just how robust the pending break will be with everyone watching it. Mr. Market rarely appeases the majority so watch out for a trap!
------------------------------------------------------------
Limited Downside Participation in Large-caps
I always check the AD Percent indicators to measure the breadth behind a move. AD Percent equals advances less declines divided by total issues. A +80% value means 90% of stocks in the index advanced and 10% declined. The chart below shows AD Percent for the S&P 500, S&P Mid-Cap 400 and S&P Small-Cap 600.
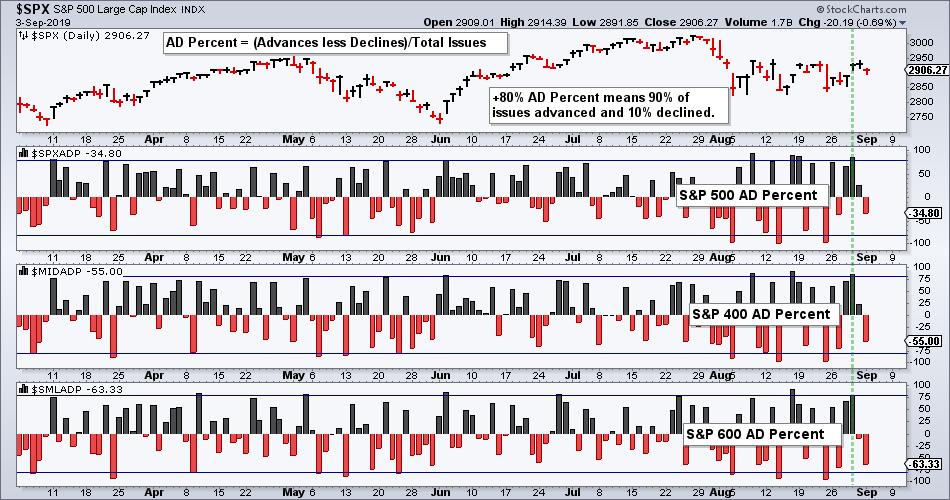
The green vertical line shows a double 80% up day last Thursday. S&P 500 AD Percent ($SPXADP) and S&P MidCap AD Percent ($MIDADP) exceeded +80% to show strong positive breadth. S&P SmallCap AD Percent ($SMLADP) fell just short (+79.58%). This one-day breadth thrust is positive until countered with a downside breadth thrust. Notice that yesterday's breadth was not that negative for the S&P 500 (-34.80%). This shows relatively mild participation to the downside, at least in large-caps.
------------------------------------------------------------
A New High in the Low Volatility ETF
The S&P 500 Low Volatility ETF (_SPLV) continues to outperform the S&P 500 High Beta ETF (_SPHB) on the price chart and on a relative basis (ratio SPLV:SPHB). Notice that SPHB formed a lower high from September to April and fell back near its early June low in August. SPLV, in contrast, moved above its 200-day SMA in late January, started hitting new highs in February and hit another new high on Tuesday.
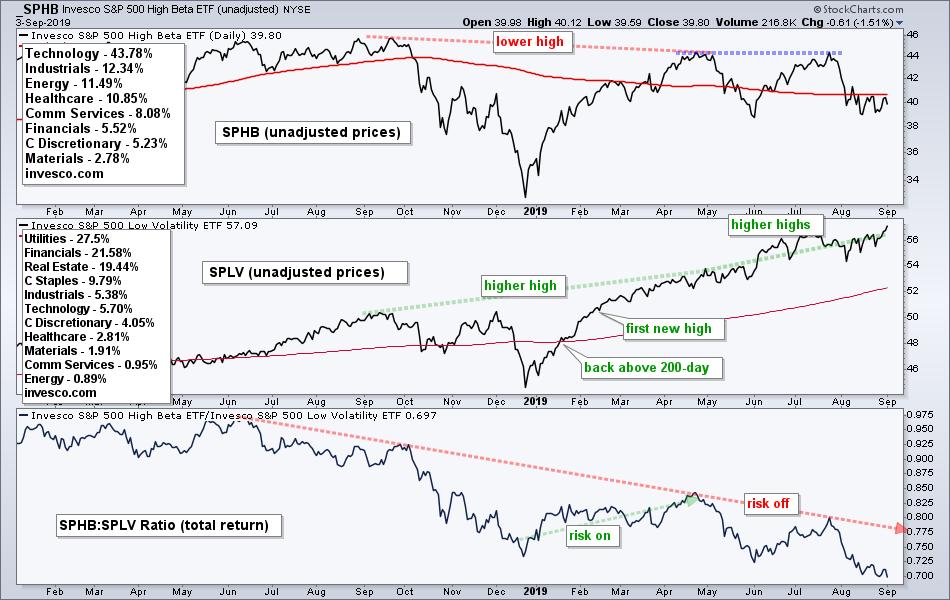
The sector weightings show why Low Volatility is outperforming High Beta. Utilities, REITs and Staples have the strongest price charts right now and they account for over 50% of SPLV. The indicator window shows the SPHB:SPLV ratio falling since summer and hitting a new low yesterday.
------------------------------------------------------------
The Canaries in the Credit Mine
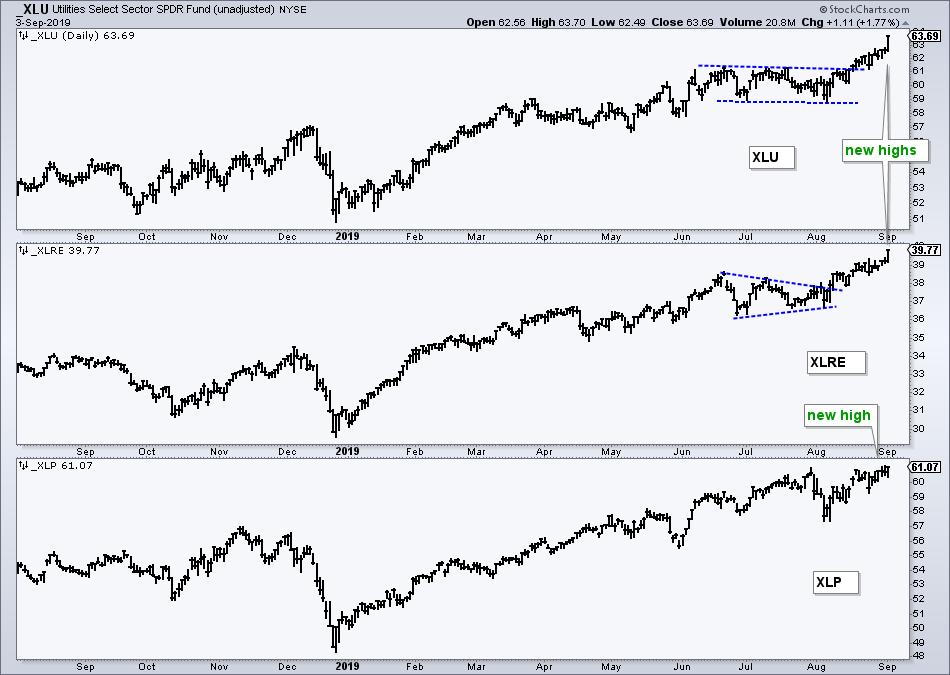
Even though Utes, REITs and Staples are leading, we are not in full blown risk-off mode. Note that SPY and QQQ never tested their rising 200-day SMAs and are still in long-term uptrends, as are the Technology SPDR (XLK) and Consumer Discretionary SPDR (XLY).
In addition, the High-Yield Bond ETF (_HYG) is also holding up. I watch junk bonds for signs of stress in the credit markets. These are the bonds with the highest risk and highest yields. They are also the most sensitive to economic conditions and sometimes act as the canaries in the coal mine.
The chart below shows the unadjusted High-Yield Bond ETF (_HYG) in the top window, its PPO(5,200,0) in the middle window and the S&P 500 in the lower window. The green lines show when the PPO moves above +1% (uptrend in HYG and risk-on), while the red lines show when the PPO moves below -1% (downtrend in HYG and risk-off).
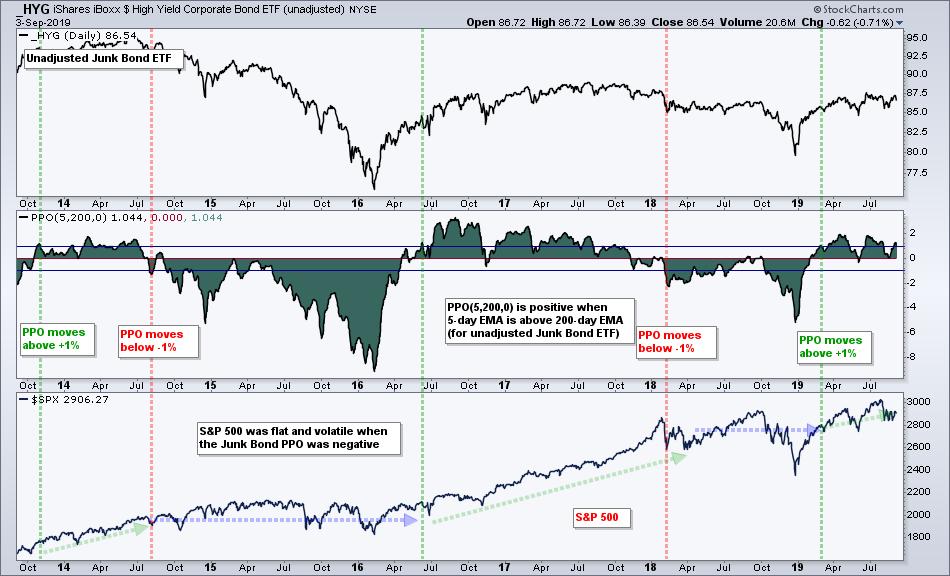
The last two times the PPO for the High-Yield Bond ETF moved below -1%, August 2014 and February 2018, the S&P 500 moved into a volatile trading range (blue lines). The S&P 500 advanced when the PPO moved above +1% (October 2013, June 2016 and March 2019). The PPO is currently positive and there does not appear to be much stress in the junk bond market. Watch for a move below -1% to change this.
Choose a Strategy, Develop a Plan and Follow a Process
Arthur Hill, CMT
Chief Technical Strategist, TrendInvestorPro.com
Author, Define the Trend and Trade the Trend
Want to stay up to date with Arthur's latest market insights?
– Follow @ArthurHill on Twitter
