Well, ChartCon 2016 is over. I am sitting in the coffee bar with Arthur Hill this morning and we are discussing some of the ChartCon wrap-up details. Arthur provided a great presentation on systematic trading. I presented the SCTR with some little twists for people who might have seen the SCTR presentation before. Reading through the follow-up questions and comments, there are some great ideas on topics for blogs and webinars. I will endeavour to answer some of the feedback I received.
During my SCTR presentation, I commented about Valeant Pharmaceuticals (VRX.TO, VRX). One of the questions related to how the SCTR would help you get out of the stock in time to miss the huge slide that happened because of Hillary Clinton's comments about Valeant. So perhaps, we should discuss that in further detail.
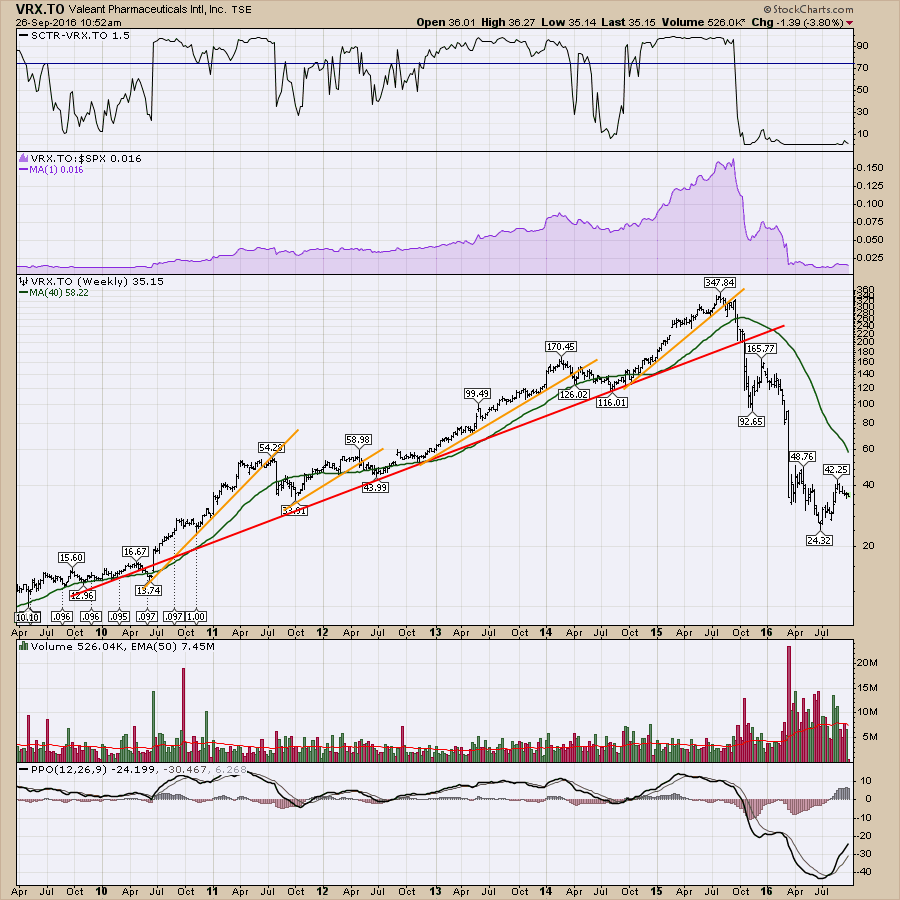
Here is the chart of Valeant in Canada, however, the same price action exists in the US. As StockCharts increased the number of International stocks with an SCTR in 2014, that is when the US ticker symbol (VRX) started having an SCTR. For today's comments, I would like to use the longer time frame on the Canadian ticker.
Notice that for the most of the period shown, Valeant had a very strong SCTR, so this is the type of stock investors like to fall in love with. When it's working stay with it. That sounds like a good rule. As this is a weekly chart and the grid underneath is 3 months per line, this is a big winner for long periods of time. The first chart is simply the major primary uptrend with four smaller multi-quarter uptrends.
First of all, an investor would have to know or understand their personal trading timeframe. Are you a trader, a long-term investor, or a swing trader?
A trader is hovering in and out for a week to a month. They rarely look at a long-term chart.
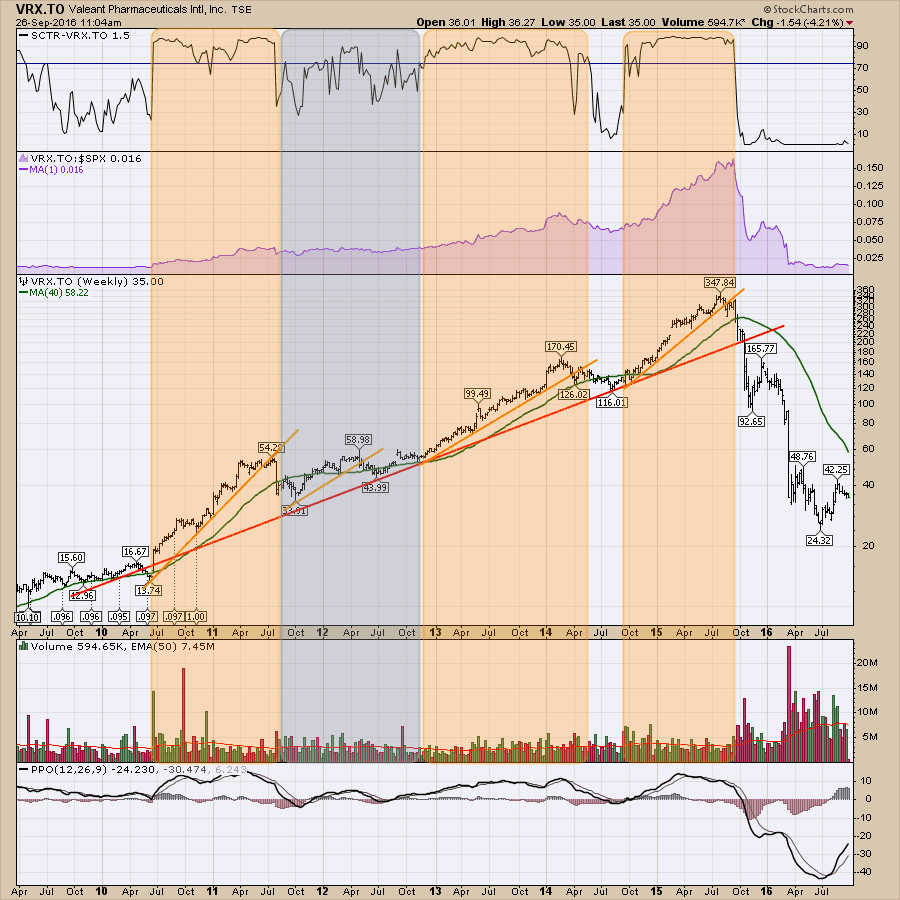
A long-term investor may choose the 40 or 50 WMA. Simply buying above the 40 WMA (green line), selling when it moves below the 40 WMA. You still have to be aware of when to leave. On the chart above there are multiple entries and exits.
The difference for me as a swing trader is using indicators to help time exits and entries a little better on a long-term chart. I like the idea of holding big winners a long time, but we still need to come and go to maximize the trade.
Lastly, there are people that will buy a stock based on a long-term uptrend and will continue to hold forever. They usually never sell a winner because there is no exit signal. Think about the last sentence.
To continue the story using the SCTR, let's just talk about a simple entry or exit. Using the SCTR moving above 75, this can make you aware of a stock starting to become a top performer. The three orange areas are great advances where the SCTR got you in early. When the SCTR breaks below 75 or 50, you have to be aware of weakening relative strength. The grey area is a very difficult area to invest in, based on using the SCTR. It continually cycles in and out of the area above 75. Looking at the price action in that area, is was also hard to hold and make money. While there was some uptrend in the grey zone, the stock did not make new highs until it left the grey area. Once again, breaking out to new highs attracted new capital.
 It is important to remember what the SCTR represents. When it is above the 75 level, the stock has some of the fastest moving price action. When it is not above 75, there are other stocks outperforming that might be a better place for your money to outperform the market. So this is not about falling in love with a stock or a story, it is about holding investments that are outperforming. The best way to outperform is to continue to find stocks that are outperforming and move out of stocks that are no longer outperforming.
As a reminder from above, the Valeant stock got chosen as a review for how the SCTR might have helped an investor in Valeant after Hillary started talking about the stock.
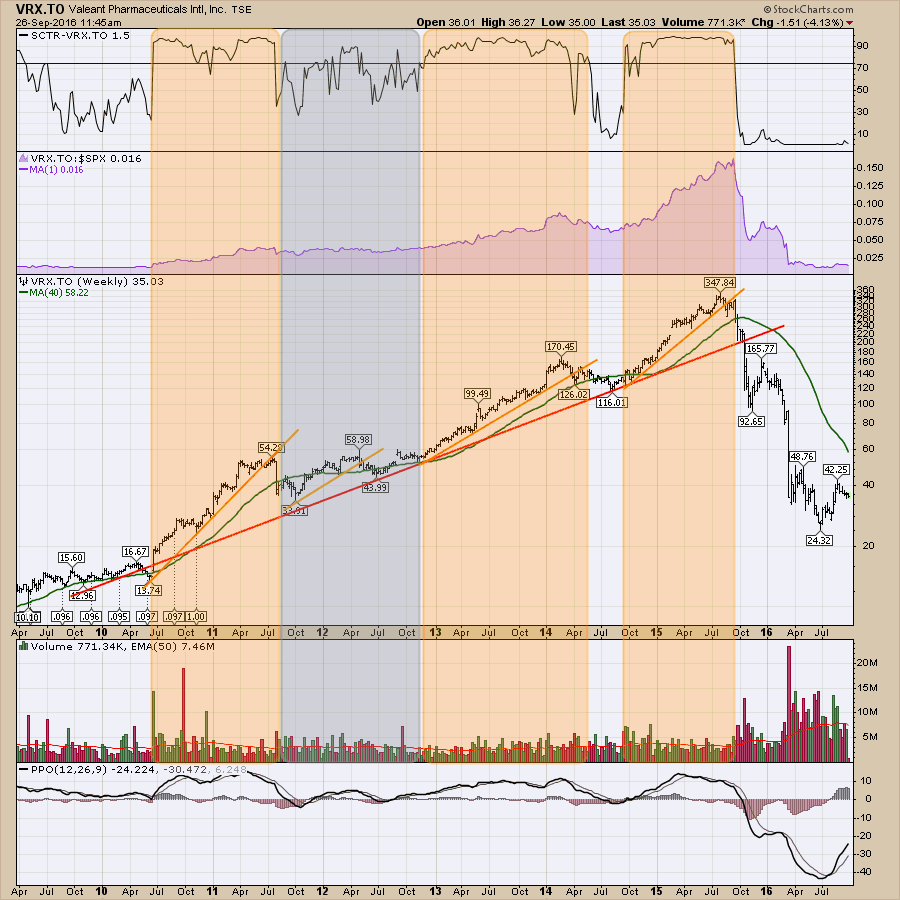
I found Hillary started talking about the stock on September 21, 2015. Then she mentioned it again on January 29, 2016. Then Hillary continued to mention Valeant in March 2016. Whether the stock broke down before, during or after the political comments around drug pricing is not as important. The real story is that the investors were starting to leave Valeant. If that was the catalyst, then an investor should respond to the price action and investor action around the stock. Perhaps investors should take it as a positive that the clue to leave was so strong. Other stocks like Apple start weakening with no apparent catalyst. Valeant is shown again for convenience so you do not have to scroll up and down.
 If nothing else, when a stock starts to breakdown, the weakening in the SCTR should make you evaluate the stock more closely.
I do think the shaded graphic above shows how even strong stocks can be traded more profitably using the SCTR as a clue for strength. The other thing to note is that your money moved into something else moving faster when the SCTR was weak. There are whipsaws that require investor attention. That happens on every stock, in every trading system. There are other clues to help with exits as well. Look at the PPO waning with negative divergence at the final high for 6 months, encouraging you to keep a tight stop after a huge advance.
The SCTR is a simple method of listing the top relative strength stocks in your investing range. They still have to be managed as a trade. Nike (NKE), Bell (BCE.TO), and Amazon (AMZN) are all prominent stocks that need managing. The weekly charts are important. The SCTR is a simple number that helps define the performance and draws your attention to a stock when it starts to become a top performer. A weakening of that performance should also make you review the stock. The stock still needs to be managed to capture the maximum profit depending on your trading style and what role that stock plays in your portfolio. The SCTR is not a magic yes/no system. But it is a pretty good identifier of performance to help you manage your portfolio.
Good trading,
Greg Schnell, CMT ,MFTA.
