The energy sector has had a rough ride since December 8th. The decline in the energy stocks has been going on for two months. Even some of the best performers last year are down around 20-25%. On the Commodities Countdown webinar 2017-02-09, I discussed how to monitor stocks in the energy group for improvements. This is starting to show up.
I like to go back and review old chart annotations and last night I came across an interesting chart on $WTIC. The date on this chart was 2014-06-03. Funny enough, it was within days of the final high before oil collapsed. Look how closely it picked some of the major lows/highs in the market. We have another week before it hits another cycle point. The cycle is close enough to be aware of potential moves. I am not a cycles expert, but this is setting up for a breakout move.
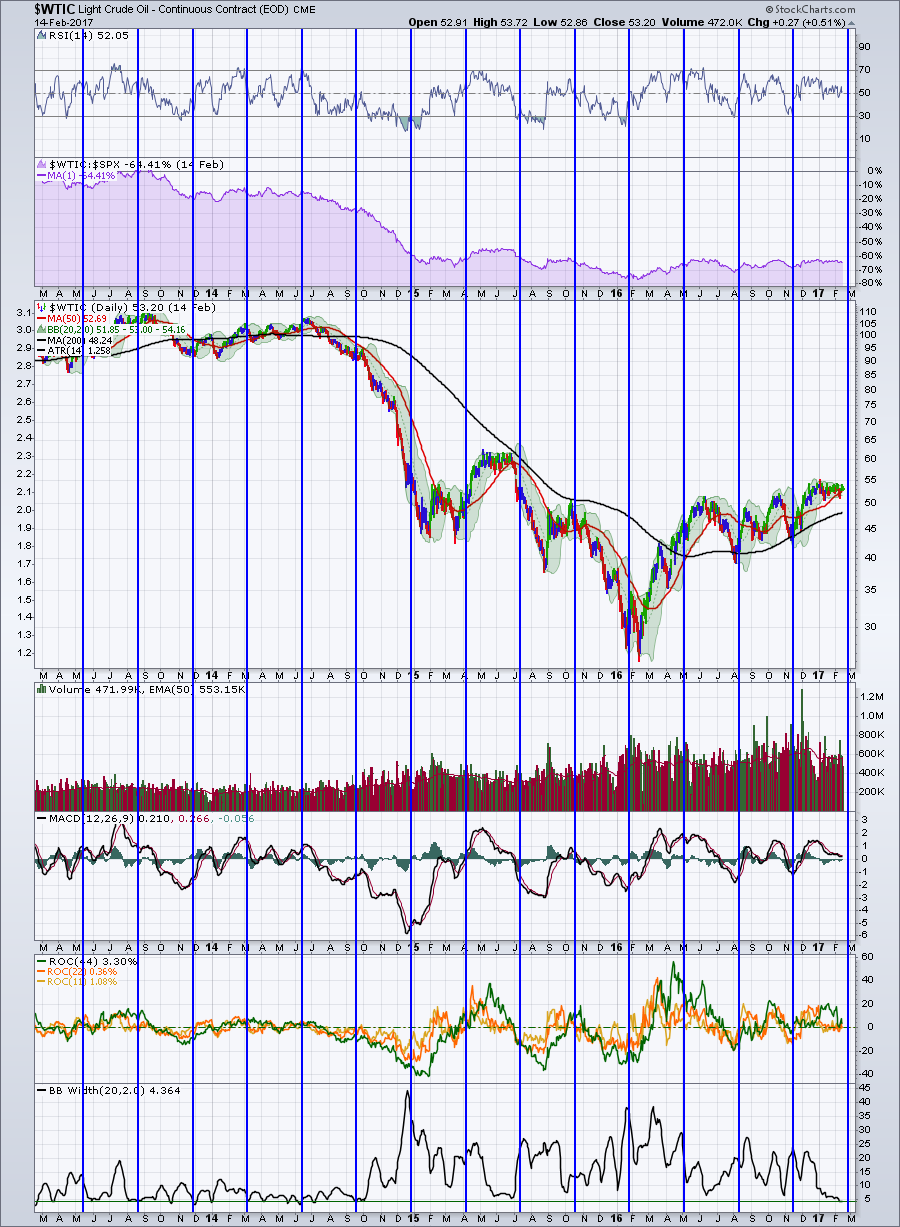
Notice the BB Width in the lower panel. We are at the same levels as 2014. There was also a long period in 2015 with low volatility that worked out negatively. Perhaps the current low volatility is reflecting some normal stable price like 2013-2014. Or perhaps its the start of a firestorm of volatility.
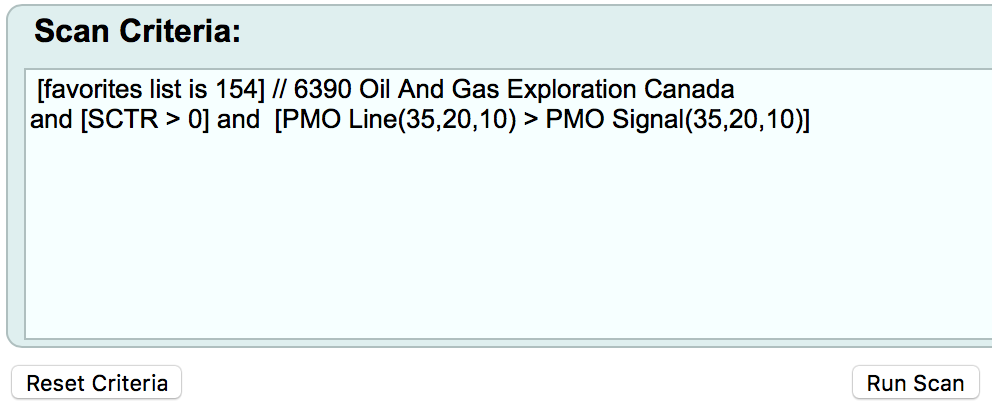
There are some nice setups in Canadian energy stocks. Using a simple scan to look at companies with an SCTR in my Oil and Gas Exploration Industry chartlist, we want to find momentum turning up. I used the PMO from StockCharts.com as it is a smoother indicator with less signals than the MACD.
 Last week's results were:
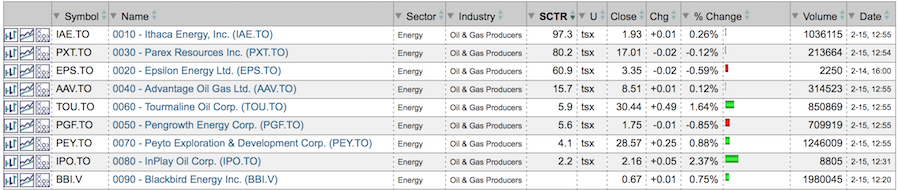 This weeks results:
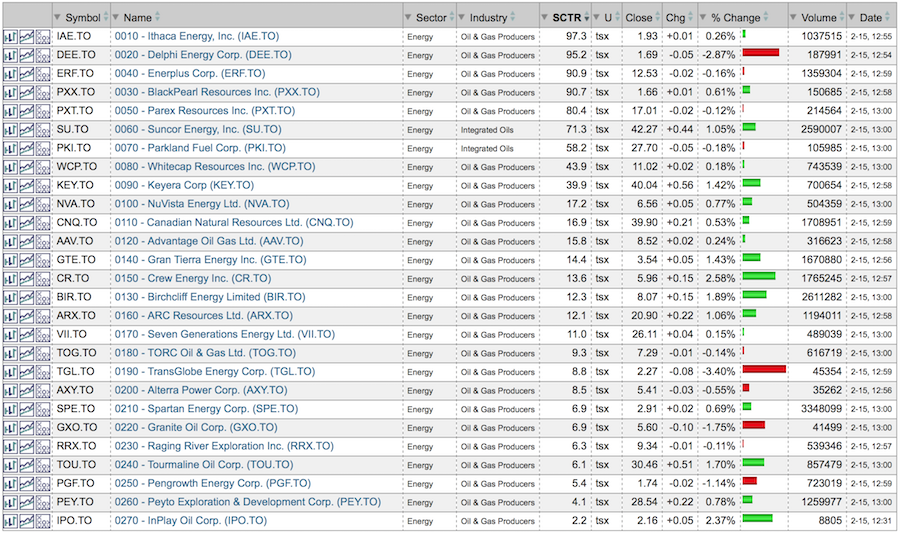 So there is definitely a pickup in momentum here. There are lots to choose from.
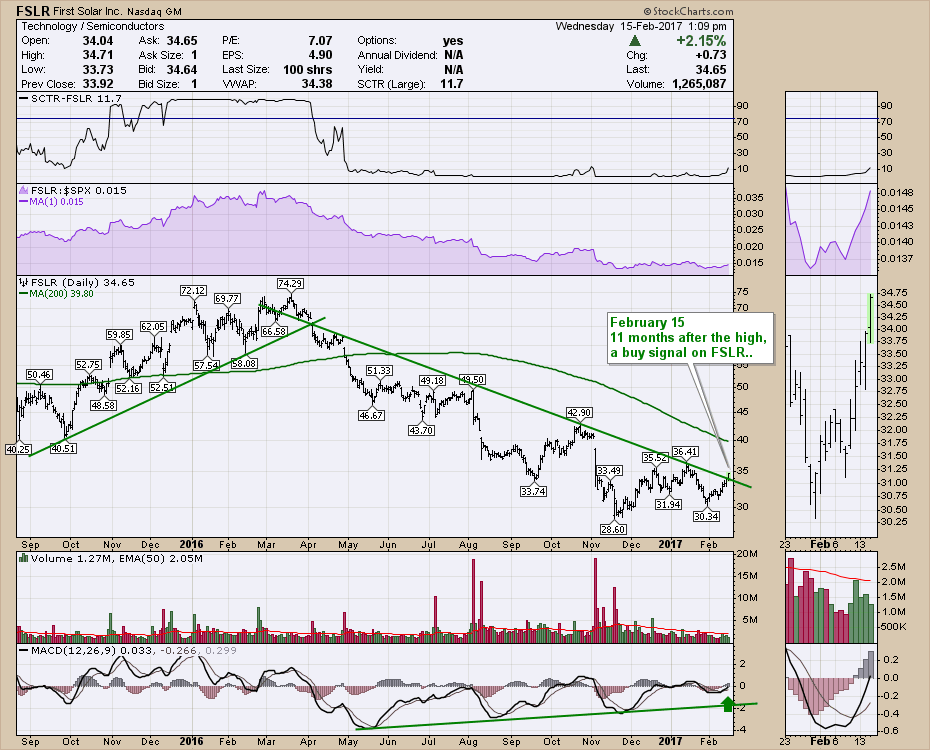
Some other interesting things are showing up and one example is First Solar (FSLR). They report February 21 so buyer beware.
 If you wanted to add positions in energy stocks there are plenty of reasons to do so with a tight stop below.
For members, if you have created a chartlist for Oil and Gas Exploration or for Oil and Gas service companies this is a very easy scan for you to help get setup. US or Canadian markets have the same tools for setting this up. If you have not created a Chartlist, I would recommend you watch the Members Exclusive webinar from Saturday February 11th to easily set these up. Using these simple setups with simple scans can really help you on your road to profitable trading. Here is a link to the Saturday webinar.
StockCharts Exclusive featuring Greg Schnell and Tom Bowley - 2017-02-11 11:00 from StockCharts.com on Vimeo.
I'll be hosting my Commodities Countdown Webinar 2016-02-16 with a lot more discussion. Please click on the link to join me.
Good trading,
Greg Schnell, CMT, MFTA.
