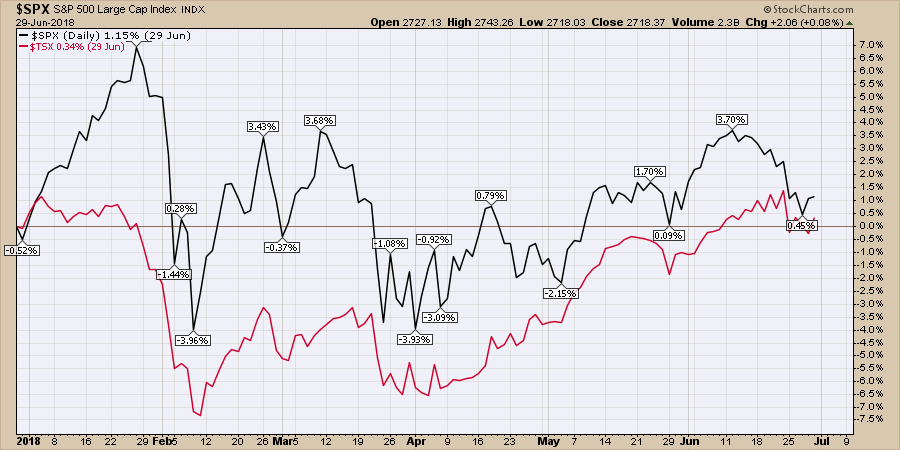
The first half of the year, saw the $TSX do nothing. After 120 trading days, we ended up 0.3% above the year-end level. The $SPX wasn't much better but it quadrupled the $TSX with a 1.3% gain. That sounds like a lot of trading days to end up within a day of being flat.
So with that as a backdrop, we need a little rodeo style to kick this market higher. Unfortunately, the current level of momentum is rolling over after being below zero. One of the key traits I have noticed in indexes is that a large percentage of the time when an index dips into negative territory, we need to be cautious that the next rally could be a final high. Weak momentum usually leads to a downdraft. Using a weekly chart, the PPO shows the momentum.
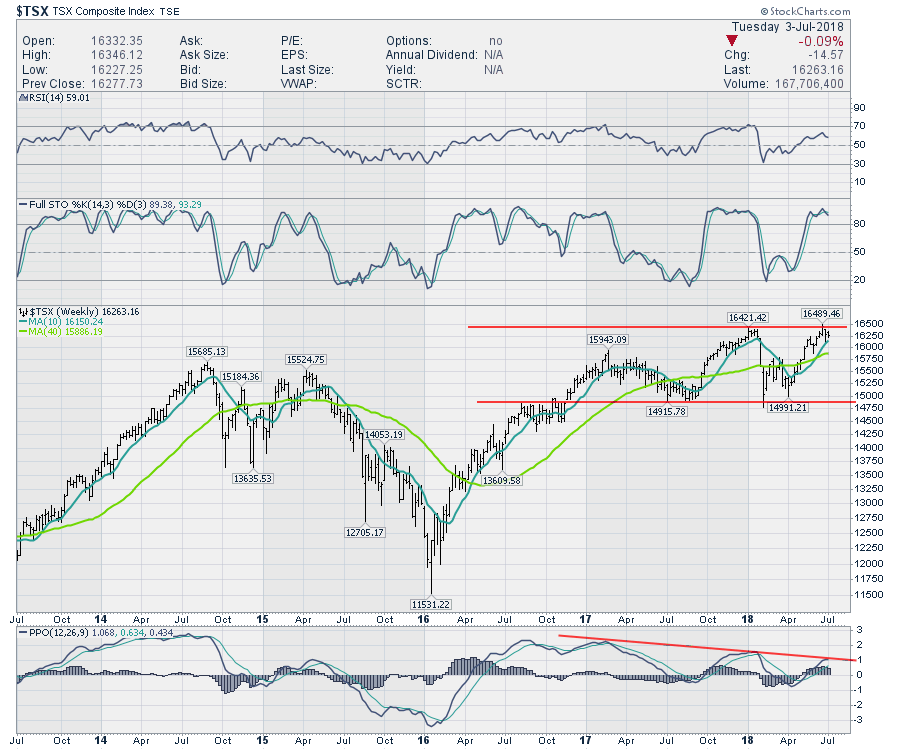
Notice the late June 2014 rally, where the dip below zero marked a prelude to a final rally. The weaker this 2018 momentum gets, the more likely this will occur again. The rollover happening at this momentum downtrend line just seems to add to the concern. That said, if we could swing above this line, I would be a lot more positive on the second half.
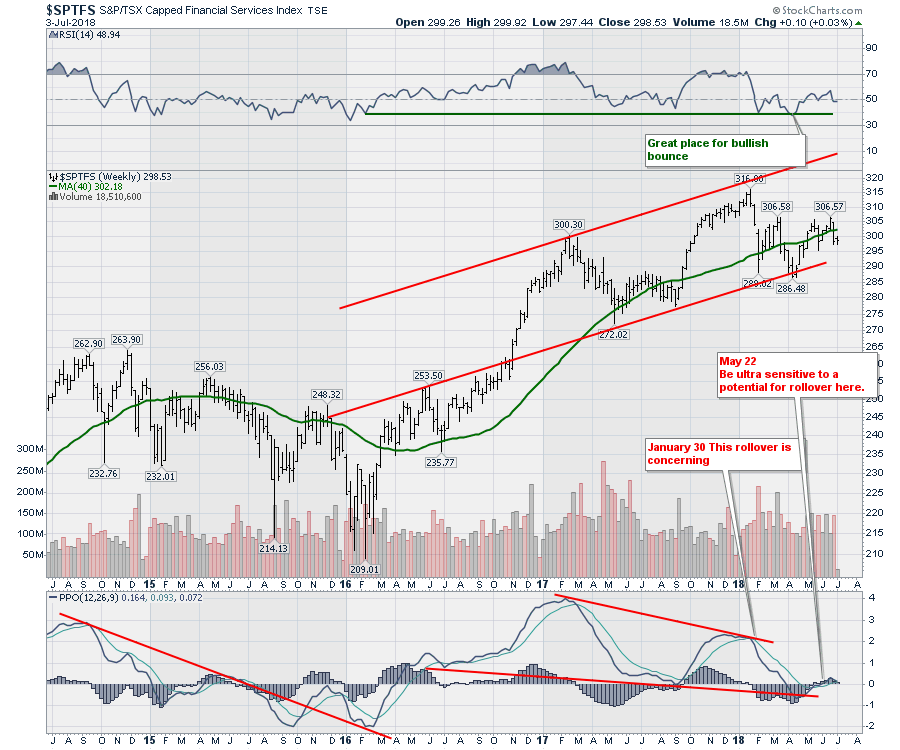
In the video this week, I made a specific effort to discuss how the Canadian Financial sector chart looks. Well, this chart lacks a lot of sunshine. It really needs to improve soon. The scenario of a final high following a PPO dip below zero is in play. The worst part? It is barely above zero and could actually give a sell signal as early as this week. When banks are weak, it is a time for caution. If it could make a little s-curve higher, that would be something, but that is not what the momentum is telling us so far. Looking at the price action, the most recent high never made it to the top of the channel. That in itself suggests the trend is not what it once was. At the current price levels, this chart has been dead money since early in 2017 if you rode it out.
 The bright spot this week is Gold mining stocks. I did a long look across the top high potential gold stocks on the video and the news is extremely bullish. While I think you should definitely watch the video, one chart represents the typical setup on the mining charts. The breakout started...today. This was a move to new 5-month highs while gold (lower panel) keeps going lower. This relative strength of the miners is a very positive development. While this may not look like much to you, the gold mining stocks on the video are kicking it!
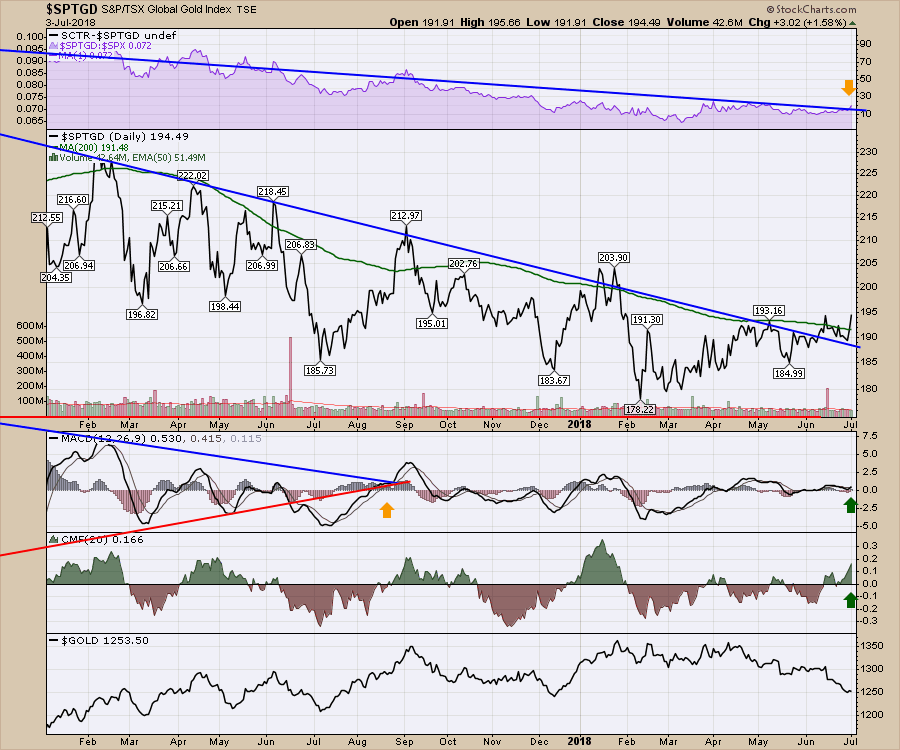 On the video I explain in detail why you should look to the gold miners rather than gold bullion. I also put some tips and tricks to demonstrate some differences between charts with big potential and small potential. If there is one trade I currently like the setup for, it is gold and silver miners. It may fail, but the hallmarks of a good setup are there.
For Canadian investors, here is a copy of the most recent Canadian Technician video. Canada suffered a failed breakout last week and I think it's an important place to learn more about what potentially lies ahead. Watch the video for more information.
If you are missing clues on signals in the market like the Gold breakout today, follow me on Twitter and check out my Vimeo Channel often. Bookmark it for easy access!
I produced another edition of The Final Bar on Thursday. I laid out the case why I am very concerned about the global market situation. While I expect some sort of rally through earnings, it wouldn't surprise me if it runs out of gas around month end. A quick 1/2 hour! It airs Thursdays at 5 PM ET and is repeated throughout the week on StockCharts TV. You'll find the short cut to the video below. You can also catch it on my Vimeo channel or on the StockCharts.com YouTube Channel. In 2011 and 2015, the market dropped in July. Trade cautiously here as the charts are weak.
Here is the half year review edition of the Commodity Countdown. I focus in on the setup in Gold and silver. Remember, commodities should be bought near their lows! The Nasdaq and the Toronto Stock Exchange both failed to hold their breakouts to new highs so this week is important. The Bullish Percent indexes are particularly precarious.
Good trading,
Greg Schnell, CMT, MFTA
Senior Technical Analyst, StockCharts.com
Book: Stock Charts for Dummies
Twitter: Follow @Schnellinvestor
