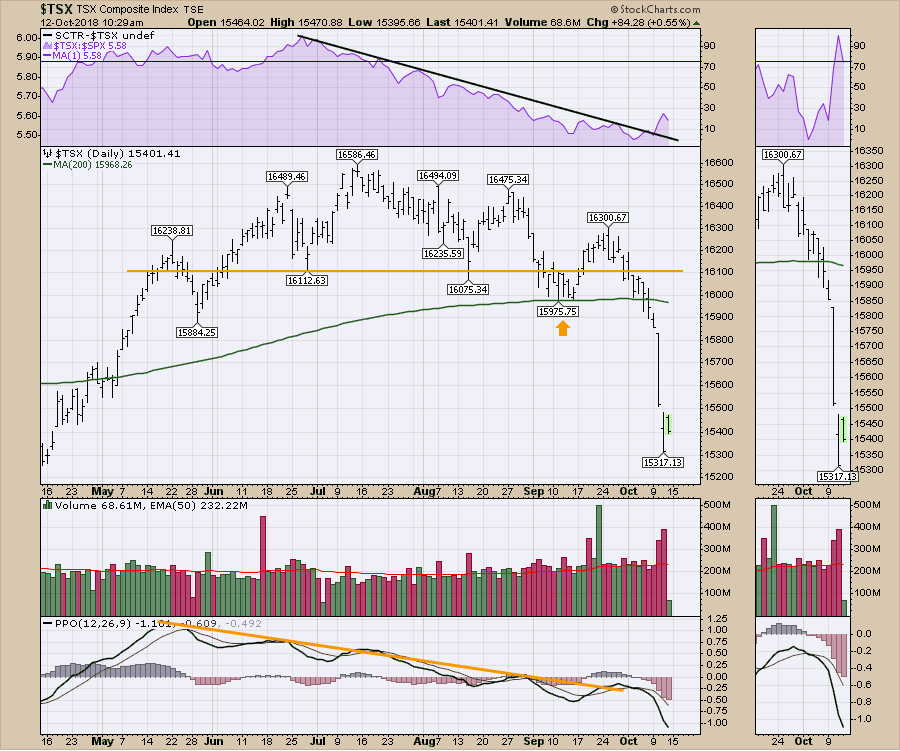
The Canadian market has been hit hard. The $TSX is currently 200 points away from the highs of 2008. Thats hard to have 10 years with little progress.
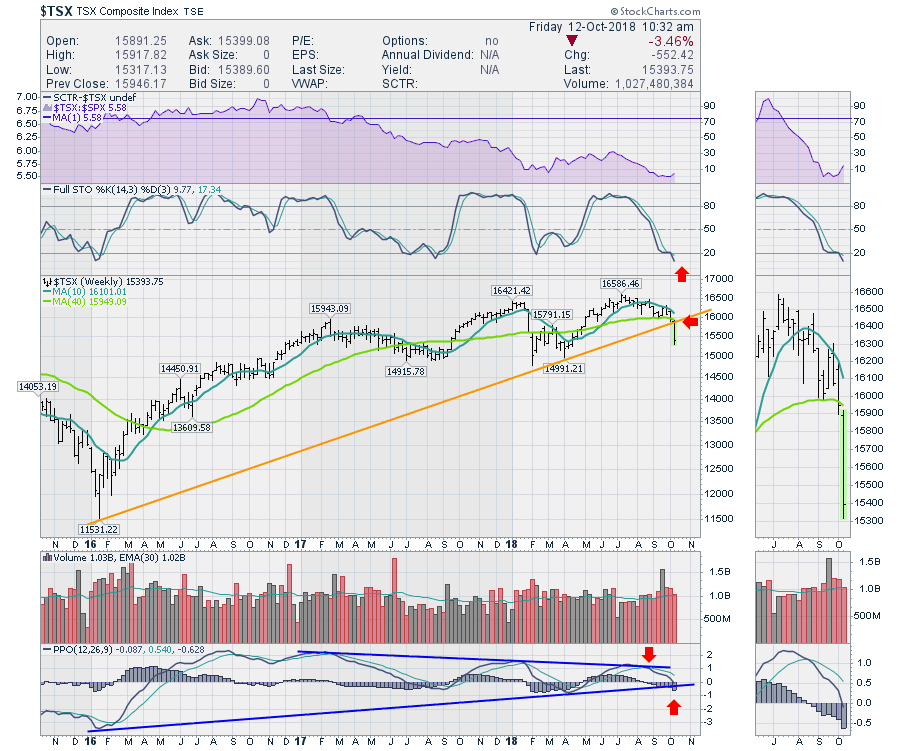
 The weekly PPO went negative this week which is another reason to be less optimistic for a fall rally. On a weekly chart, the trend is the big thing to be aware of. A down candle at the end of a bad week makes the chart look bad. In this case, it is the location of all the indicators as the chart is breaking down that reinforces the negative sentiment. Most significant breaks of the 40 Week MA change computer trading models from bullish to bearish. Looking at the 40 WMA that was the final line of bullishness on this chart. Now we need some base building to begin.
 The monthly chart for the $TSX is problematic as well. The big uptrend line has lots of touches suggesting it is the most relevant line. The big drops in 2008 and 2016 were signed of weakness when they dropped below the lines. Now, the price action continues to test the trend line and can not accelerate away from it.
The horizontal red line is set at the 2008 intraday high. You can see we are just barely above the level. The top panel shows the Canadian economy considerably underperforming the $SPX.
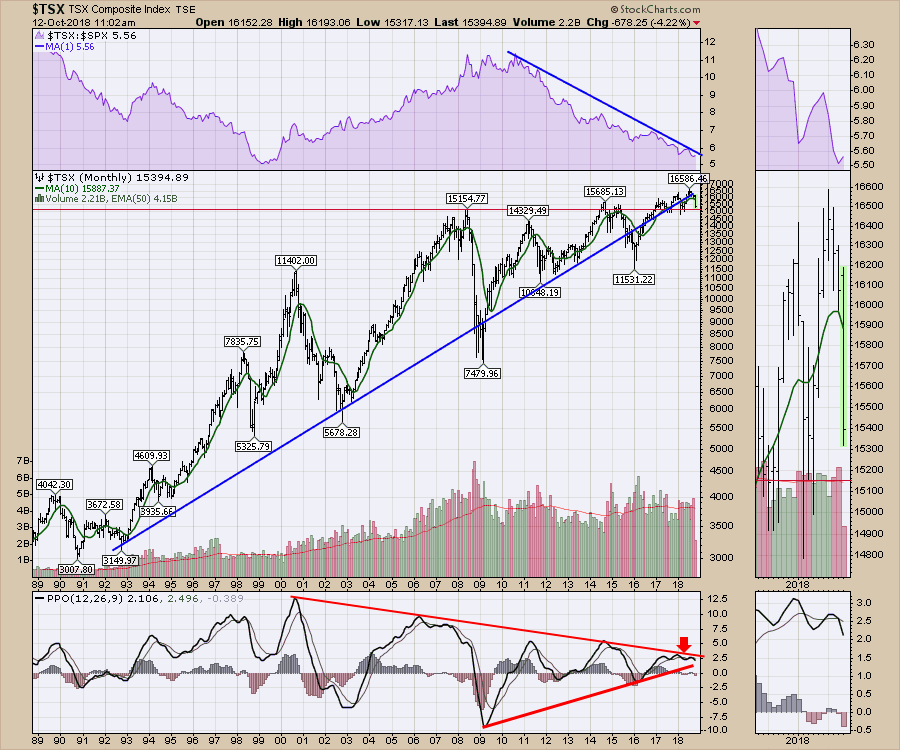 Staying with the chart above, the PPO is rolling over again after crossing back above the signal line briefly. Looking left on the chart, this drawn out topping structure usually leads to a large rollover. It is also at risk of breaking the PPO lows uptrend line. A line off the 2009-2013 lows hit in may 2015. That was our last big rollover.I didn't extend the current line as we are at the apex of the two lines. The final resolution is about to be discovered in the fourth quarter of 2018, early 2019.
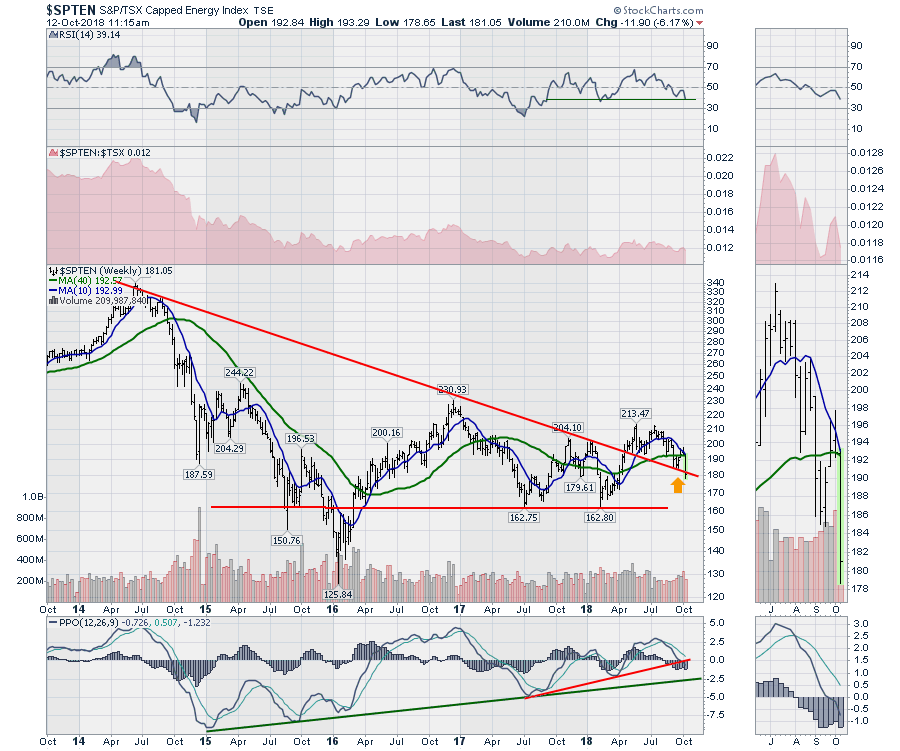
The Canadian Technology sector got smoked over the last two weeks. It will need time to heal. While there should be great trading in these volatile names, the uptrend has been broken. Trade cautiously.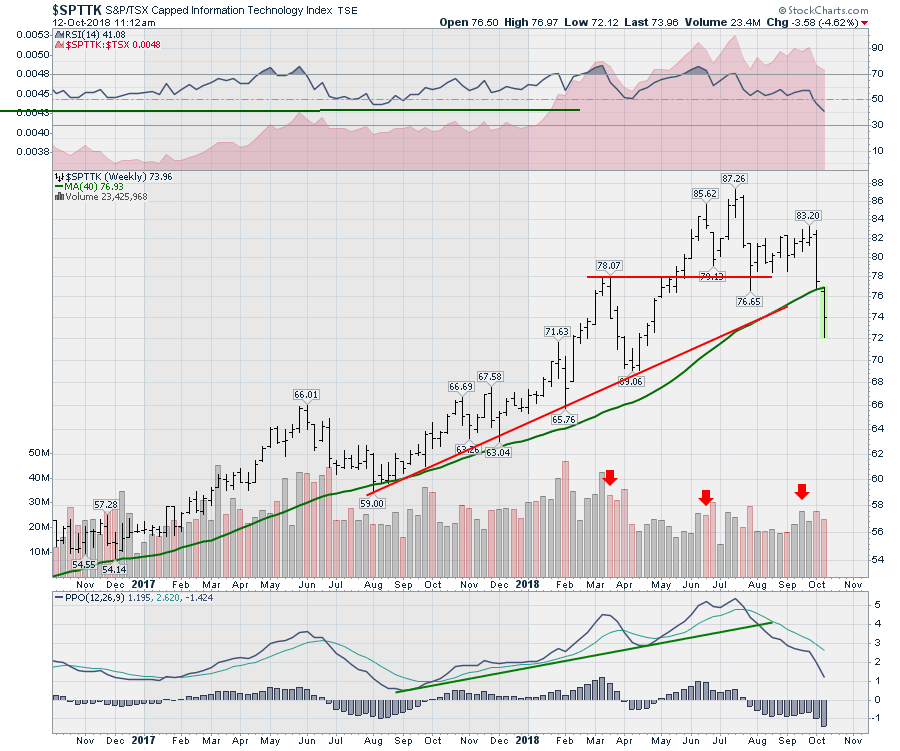 The Canadian energy sector is under extreme pressure. The price of Western Canada Select was under $20 on Thursday. Be careful expecting US energy sector optimism to show up in Canadian charts with this difficult price level.
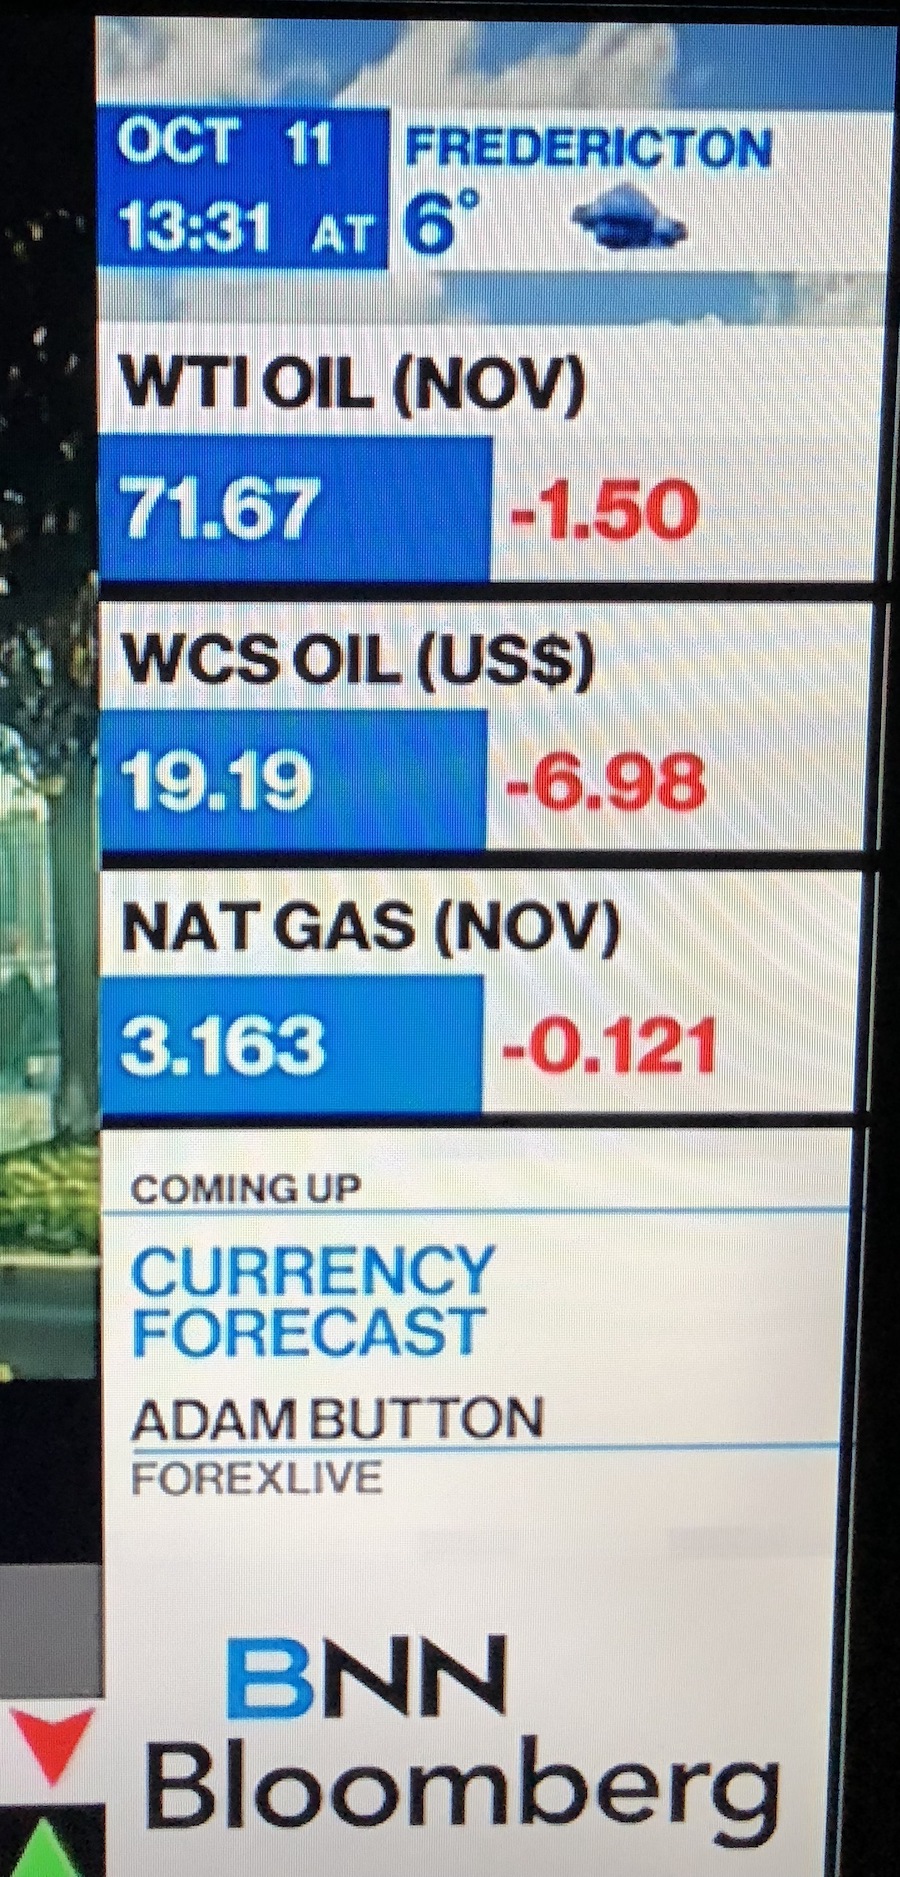
 Here is a screen shot I took off my TV from BNN Bloomberg yesterday. Western Canada Select (WCS) is trading $52.50 under West Texas. There was a $6 or 25% drop on Thursday alone!
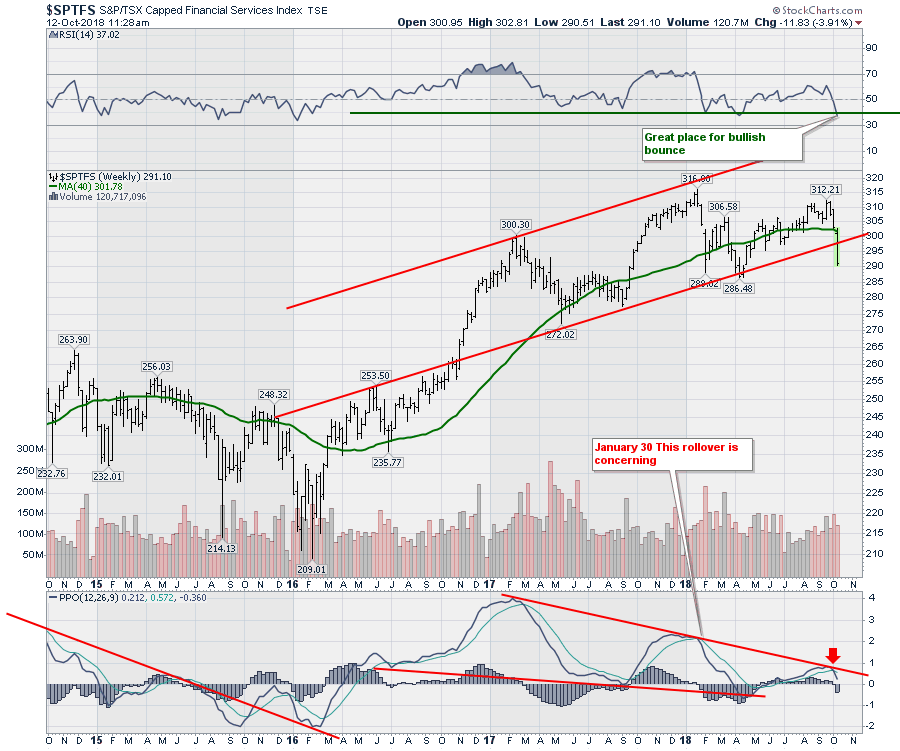
 The Financial sector broke a two year channel this week as well. Notice the PPO rolling over right at the trend line. There is a strong argument on the price panel for a head and shoulders top developing.. A PPO accelerating down below zero would be a confirming signal of a sector to avoid. Notice the PPO in early 2015 went below zero. The next rally was your final exit. On the 2018 area of the chart, the early lows took momentum below zero suggesting the next rally could be the last. With the low slope on the PPO line, the rally looks significantly weak. With the recent rollover at the junction of the PPO downtrend line, this looks ominous for the next few weeks to months.
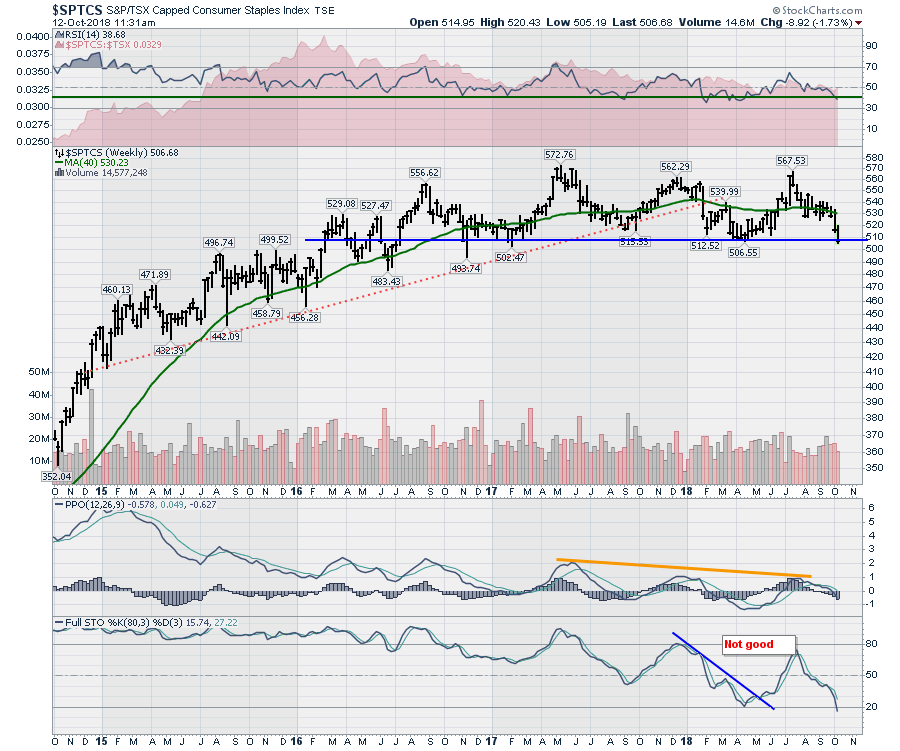
 Even the Consumer Staples sector is on edge. As a technician, buy at support with a close stop usually. But this topping structure looks difficult to expect a rally in the face of broad weakness in Canada. Notice the PPO signature is similar to the one just described for the Canadian Financials.
 Notice how severe the breakdown in Consumer Discretionary has been. It has accelerated since the AFTA NAFTA agreement.
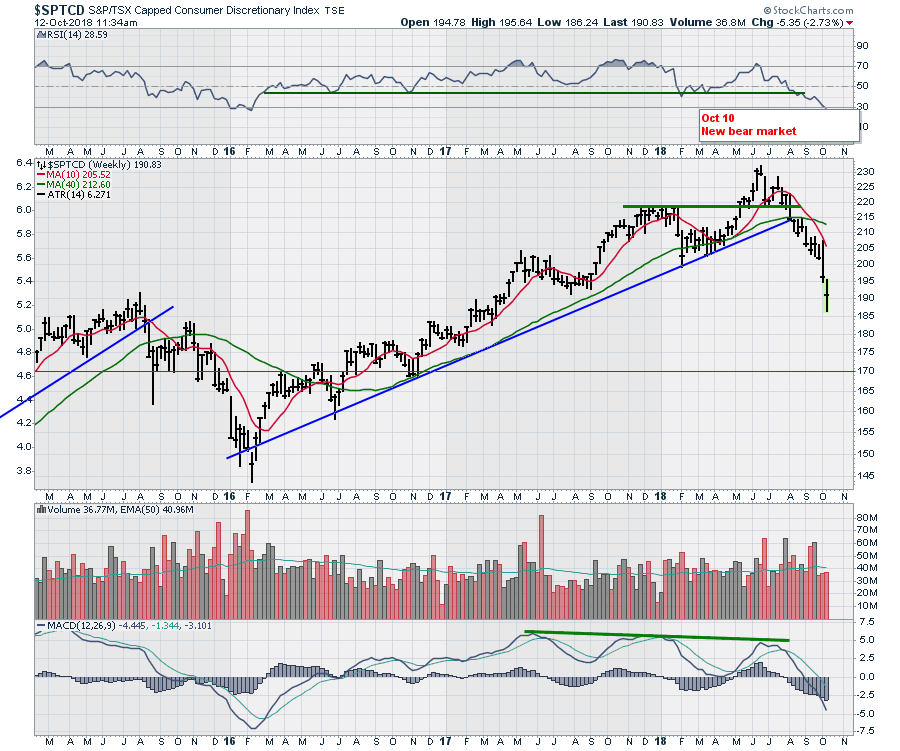
I covered off Telecoms on the video. Its particularly important if you want to own those stocks to hear the discussion on the video.. Let me just heap giant loads of caution there.
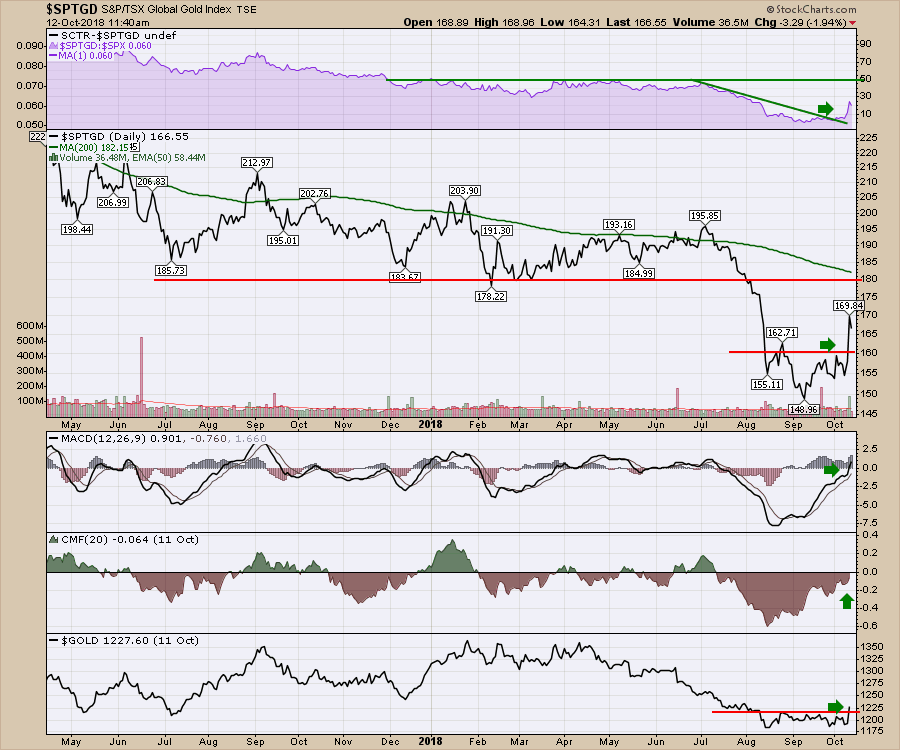
One area that gave a glimmer of hope in a positive direction after a relentless tour of beaten up charts and stocks is the Gold Sector. The chart has formed a nice base and Gold polished up a $34 gain on Thursday. Gold and the Gold miners both broke through key overhead resistance. When something starts a big move it usually needs an initiation thrust. I would suggest that is what we saw in Gold on Thursday after a nice head/shoulders base was built.
 I would encourage you to watch the video. Leave your bias (optimism or pessimism) at the door and try to use an open mind. We should get some great bounces in here, but until the charts start to improve, don't expect a selection of great big moves to come rolling in.
The Canadian Technician video is concerning as the market struggles. This week the Canadian market started a breakdown.
If you are missing intermarket signals in the market, follow me on Twitter and check out my Vimeo Channel often. Bookmark it for easy access!
Good trading,
Greg Schnell, CMT, MFTA
Senior Technical Analyst, StockCharts.com
Author, Stock Charts for Dummies
Want to read more from Greg? Be sure to follow his StockCharts blog:
The Canadian Technician
