- Crude oil dropped to close the week well below support
- Brexit deal signed with the UK & EU on the weekend
- US Dollar ended the week higher
- Gold - I'M PAYING ATTENTION - Important defining moment
- $SPX ends with a lower Friday close than the October low
Crude oil plummeted on Friday. The drop was substantial. The media always sells it as a blessing. Well, actually it's not. The number of jobs tied to the oil business is huge. I think everyone will find this old article particularly interesting. Oil and the Dominoes February 2016. Every market top is different. As the article from 2016 shows, it takes time to record the breakdowns in sectors, but they all seem to get dragged down over time. What I think is prescient about the article was that it was written a week after the lows were in. None of the weekly charts had a rising trend at that point so it was still unknown what the future would bring. As the charts improved, later blogs would tell the story to get back on board.
The current market top has seen the housing sector rolling over, the FAANG stocks have rolled over and now energy is following the broad market lower. However, now it would appear that energy is leading the drop as it plummets from previous levels. Looking at crude oil first, this is a big deal.
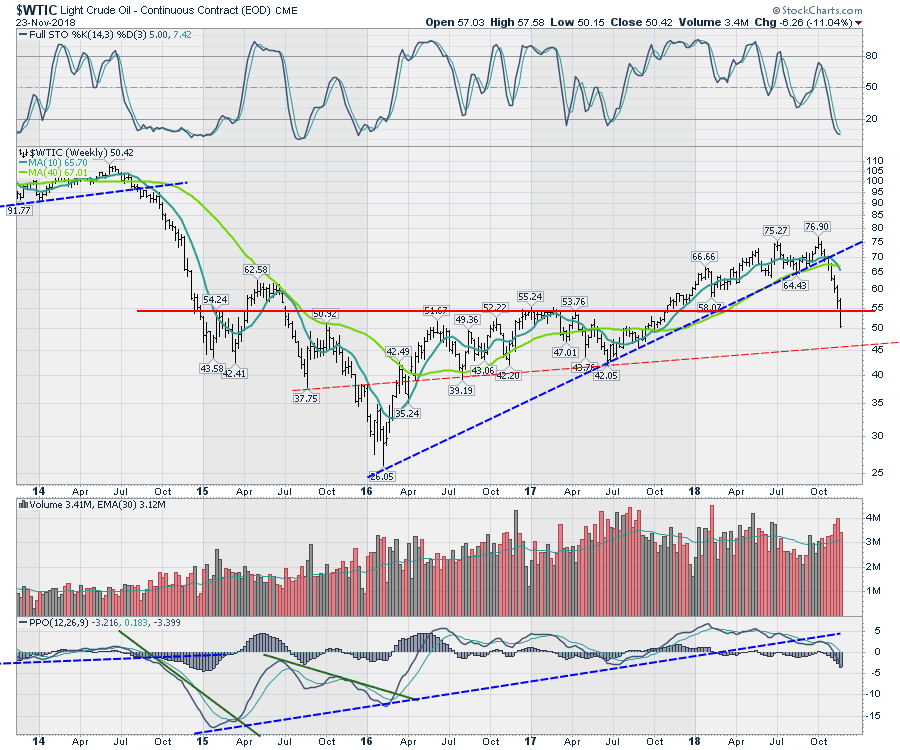
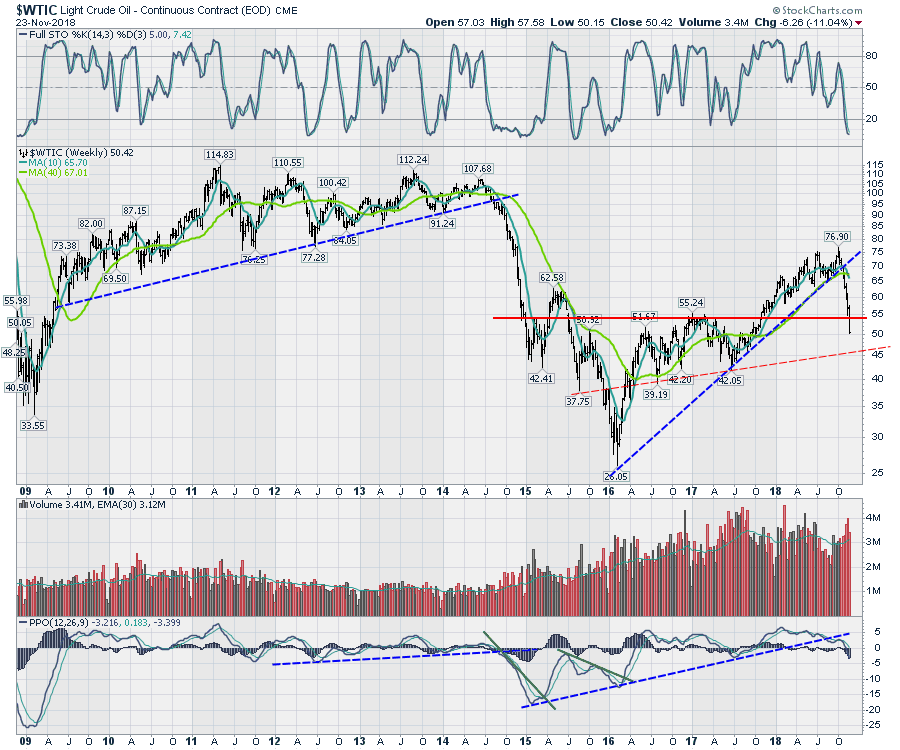 Drilling down on the last five years, let's check in on the oil slick.
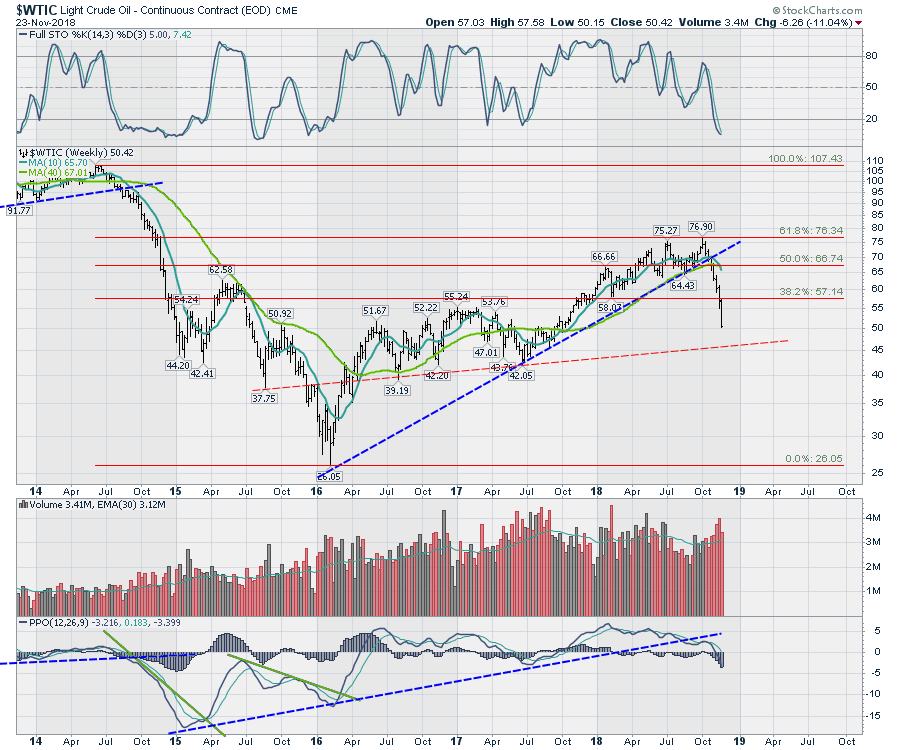
 When we added fibonacci lines, (I am sure many of you have seen this chart), the fibonacci level of 61.8% retracement was hit!
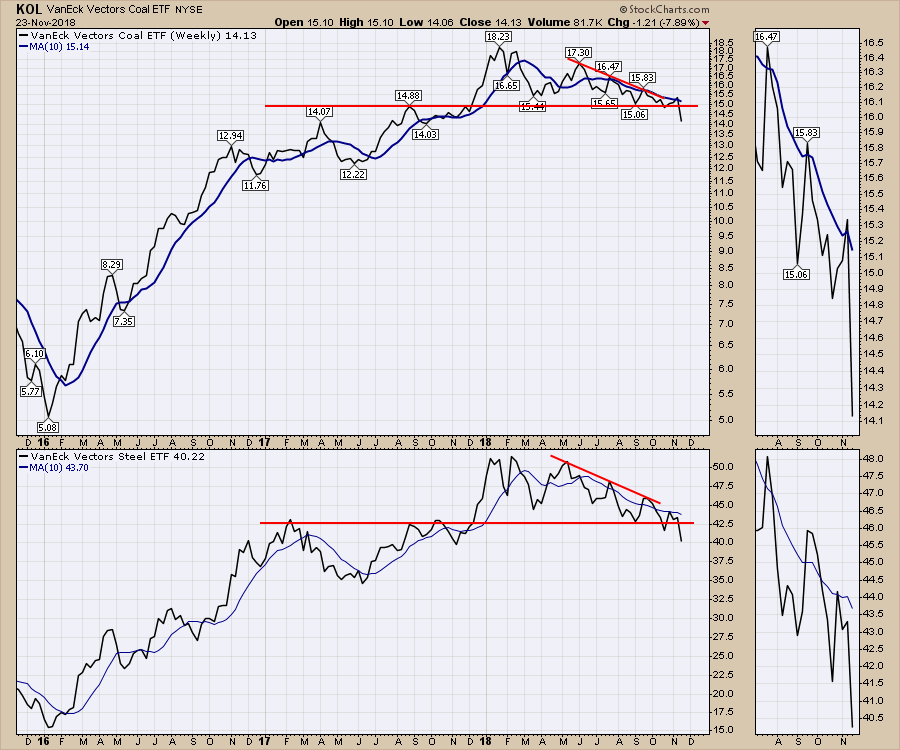
With the Steel and Coal ETF's breaking support meaningfully, this is problematic as it created a false breakout on the KOL ETF. It had moved just above the down trend line and the 10 WMA only to reverse and fail.
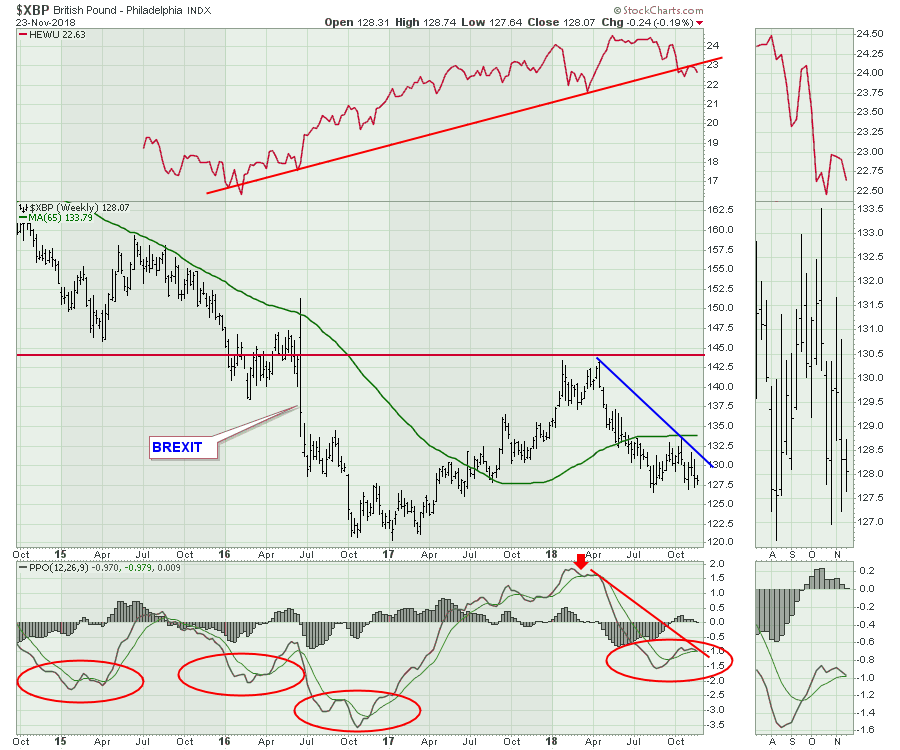
 I will be watching for any strength this week in the Euro. With the agreement on Brexit, this may create some volatility in currency pairs. Below is the British Pound to the US Dollar. HEWU on the top panel is the hedged ETF for the British stock exchange. On the bottom panel is the PPO for the currency. Notice how it likes to make complex bottoms. As we already have a lower wave, will this make a higher low here on the PPO or do we need a few more weeks to get the move up going?
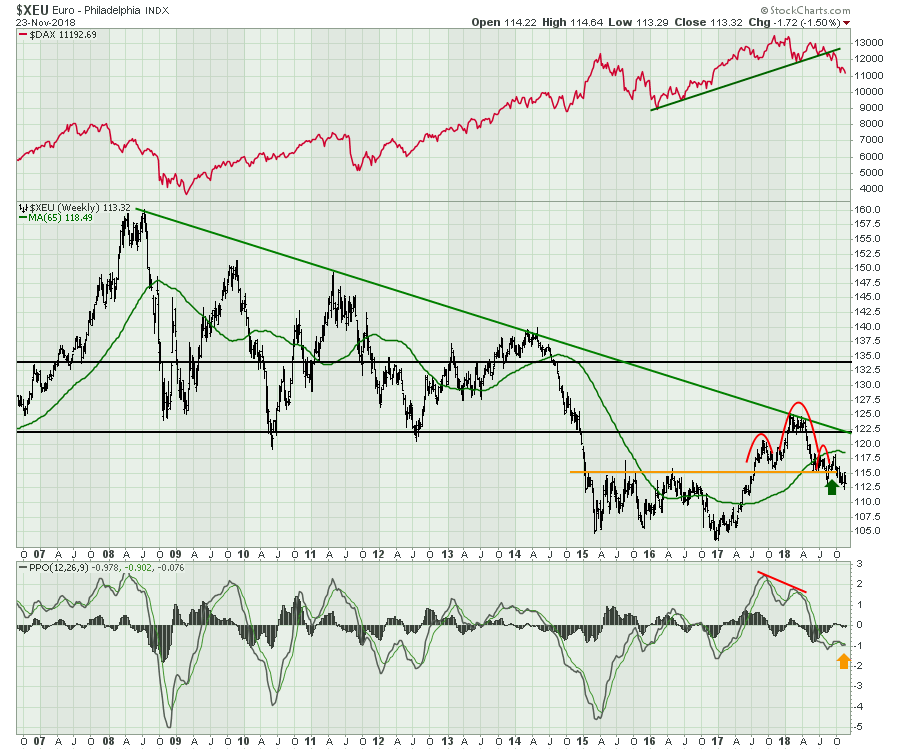
 Below is the long term Euro chart. It is important to understand the big long term down trend in the Euro. After trying to break through the downtrend earlier in the year, the chart is clinging to the horizontal support/resistance level shown in Yellow.
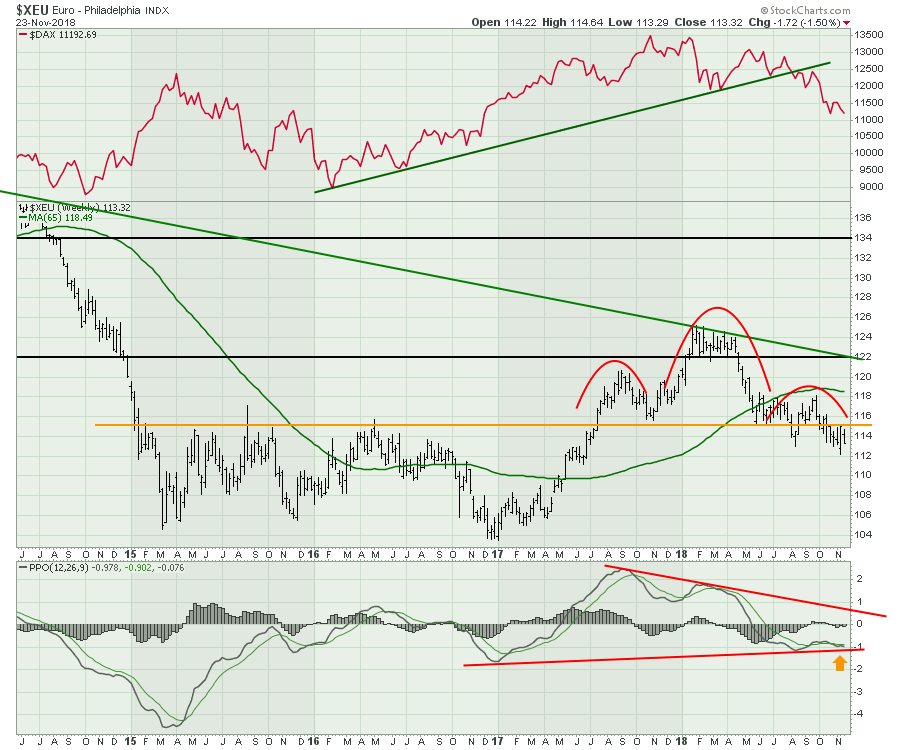
 The next chart zooms in on Euro for the last 4 years. If the chart breaks down after this sideways consolidation, it would probably suggest the Euro moves down to 104-106 again looking for support. Conversely, if the market starts bidding the Euro up here, this is a very important inflection point. The momentum shown by the PPO is flat here. The Euro doesn't really stay with flat momentum so I am expecting a move either way shortly.
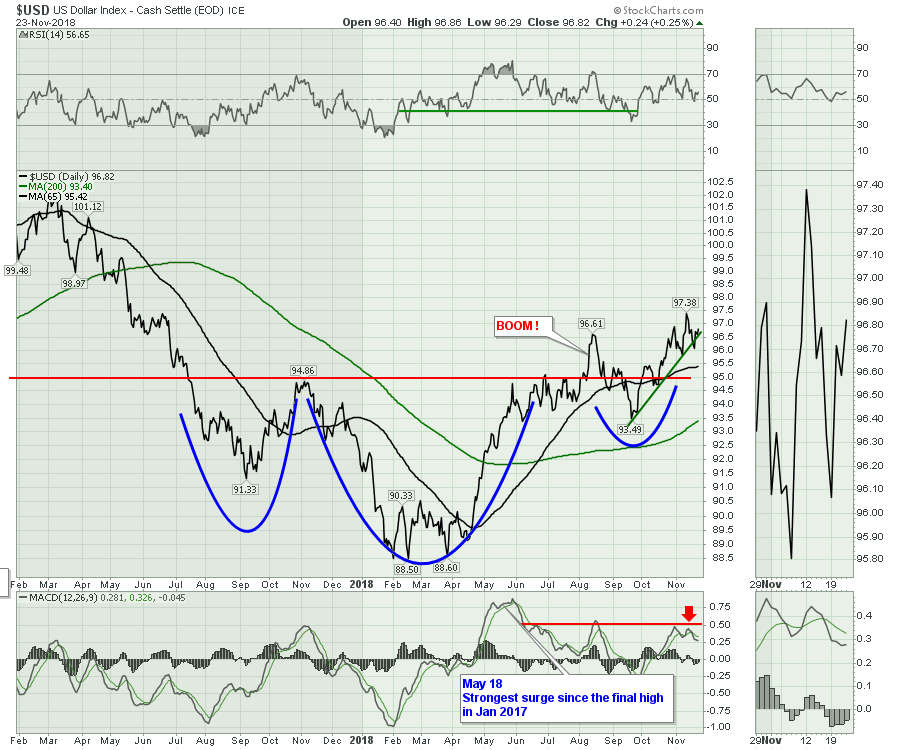
 The opposite side of the Euro chart above is the US Dollar. It couldn't be more finally tuned. The PPO has rolled over again, suggesting weakness, but Friday's surge looks like it wants to go higher.
 The currencies will be important this week. Stay tuned!
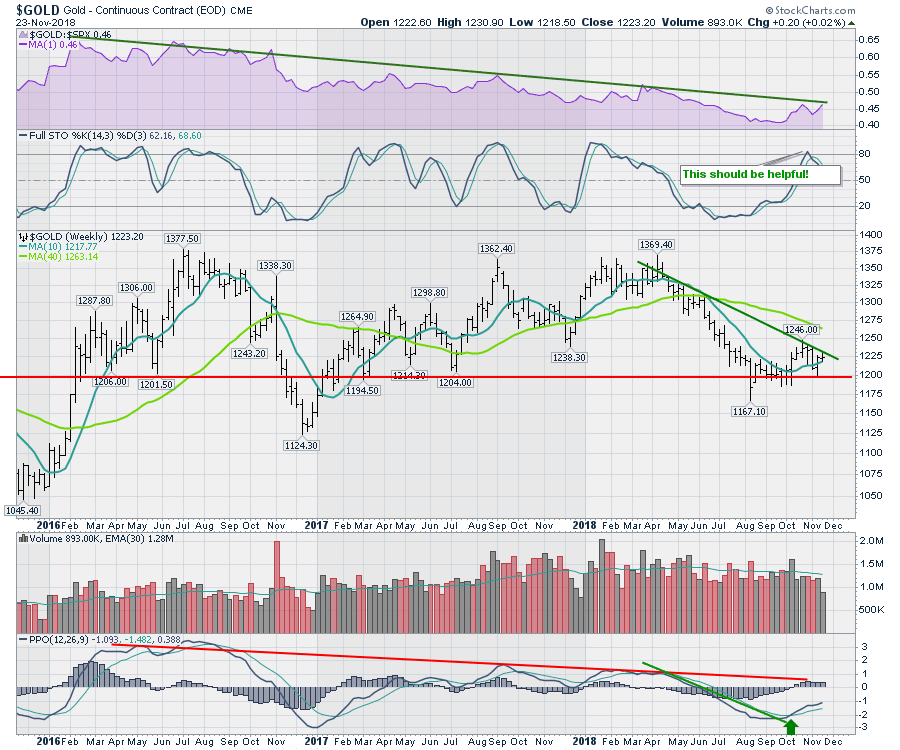
Gold...I really like the chart shape but this week is where we find out if its breaks out. The price was flat for the week which isn't that bullish. If it is to start breaking out, it needs a big surge here. Can you see all the reasons on the chart? Some reasons include highest Thanksgiving volume in three years, the RS line in purple is about to break, the price trend line is touching price this week, and the PPO is rising.
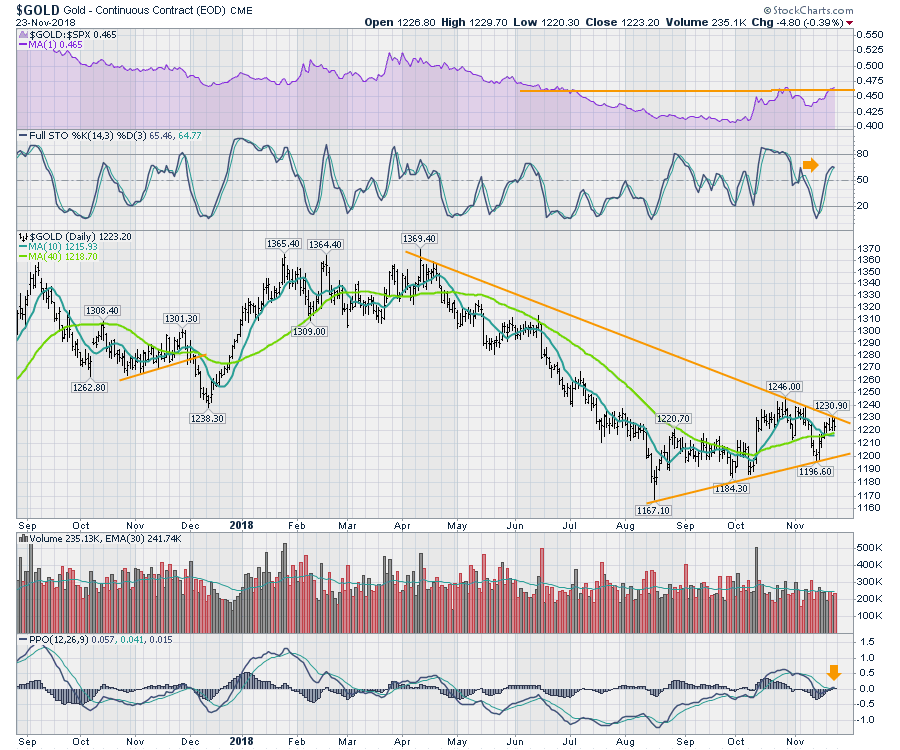
 On the daily, the picture looks more mixed. The Relative strength is just below 6 month highs. That would be a helpful breakout, should it occur. We want the full stochastics to get back above 80. Rolling over just below is bearish and the PPO is currently right at the zero line....Not a good place for momentum to stall. November had a fake out rally last year before really getting going in December... All hands on deck, this is an important wave.
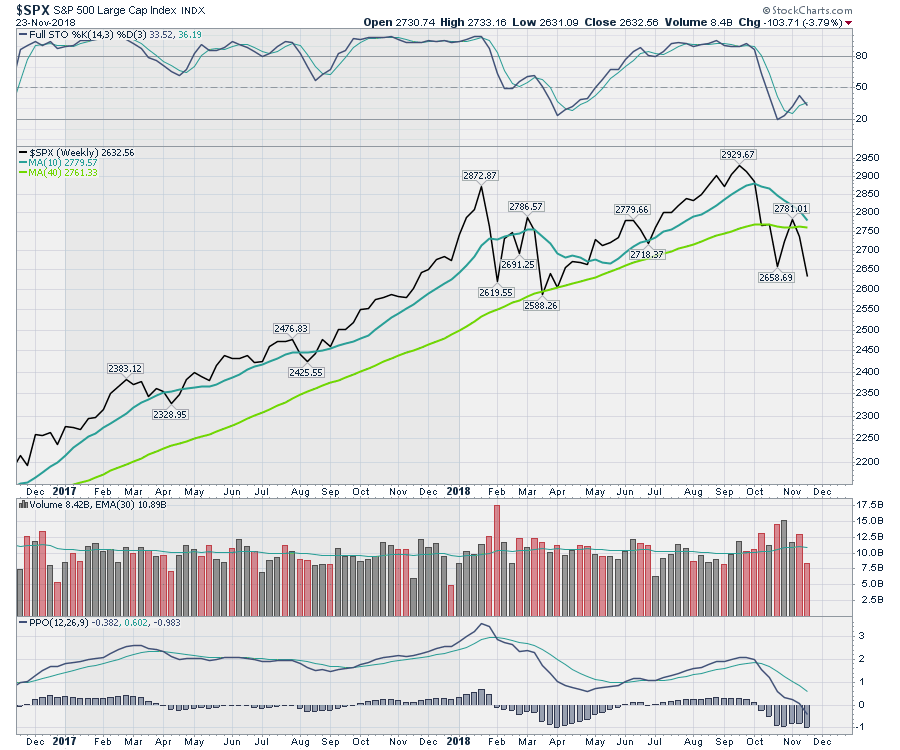
 Lastly, the lower closing low on the $SPX and $COMPQ would really scare people off. Lots of the people I talked to this weekend were scared on this low, whereas the January/February/March lows did not concern them. Interesting, because this time we are trapped under the 10 and 40 week MA's whereas the spring lows held at the 40 WMA.
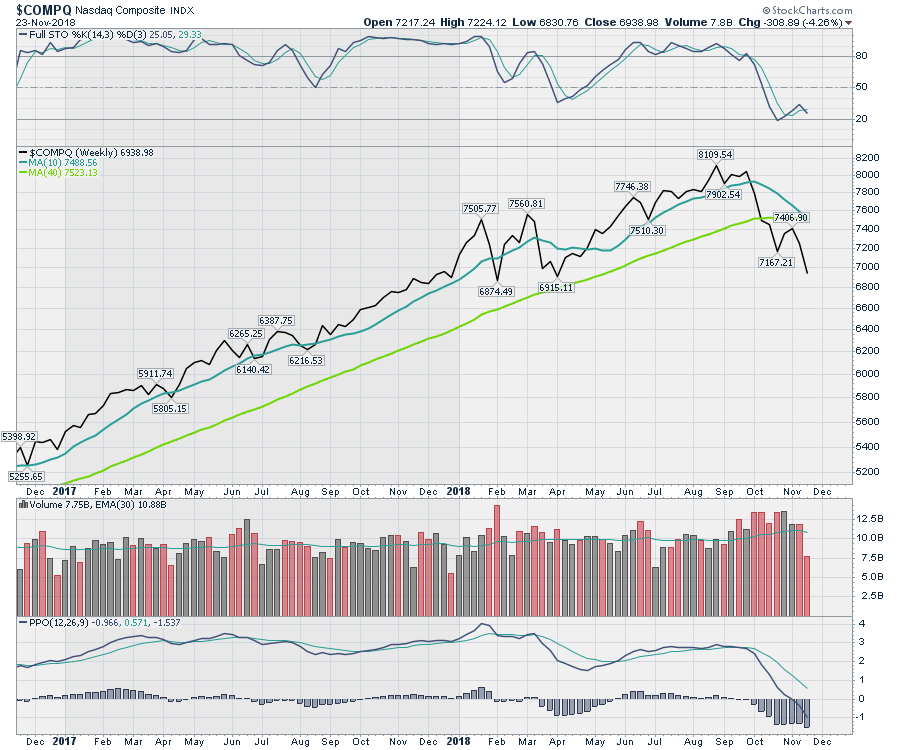
 For the $COMPQ, it gets even more interesting. The moving averages have had a bearish cross filling the business press with chart talk. The current low is significantly lower than the October low but still in the same range as the lows of Spring 2018.
 Lots to consider here, but I'll be looking for the rally to start soon. Close stops in case I am wrong obviously!
Here is this week's broad market review video.
A funny story from this weekend. My daughter was at the library signing out books. She looked to see if the City Of Calgary library had ordered any of my books. Well, the good news was they had five in inventory, but they were all signed out and a waiting list! That's fun for me to hear!
If you are looking for a small gift, you might have family or friends that would like to learn more about the basics of charting. The first section of the book walks through all the chart settings to get the charts you want. The second section is why you might use charts for investing and the third section is putting it all together.
Click here to buy your copy today! Stock Charts For Dummies.
The Canadian Technician video shows the bounce off the late October lows in Canada. Canada is back below the 2008 highs. Tough ten years for investors.
If you are missing intermarket signals in the market, follow me on Twitter and check out my Vimeo Channel often. Bookmark it for easy access!
Good trading,
Greg Schnell, CMT, MFTA
Senior Technical Analyst, StockCharts.com
Author, Stock Charts for Dummies
Hey, have you followed me on Twitter? Click the bird in the box below!
Want to read more from Greg? Be sure to follow his StockCharts blog:
The Canadian Technician
