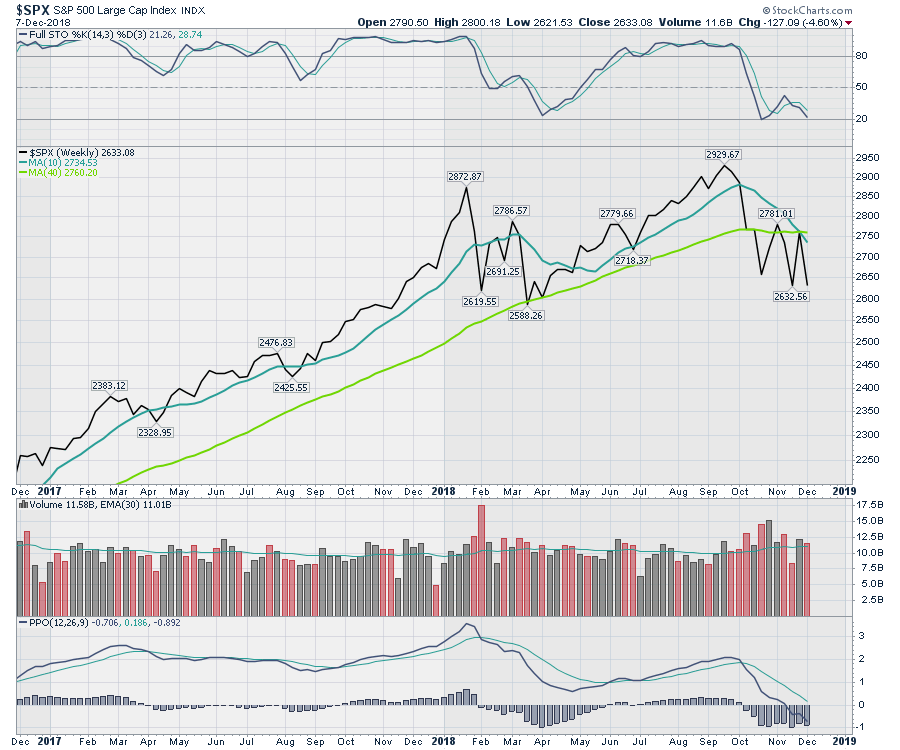
In what was a rough period for equities in general, Gold managed to have a great week, following through on its breakout. Oil continued to hold in the 50s, while the $USD made a second lower high on the daily line chart. The story in bonds continues with the 1-5 year yields inverting. The 10-year has moved dramatically lower. With the China-America tariff discussions raging, the equities had some wild swings, finally stalling above the 200-day moving average again. Breaking into the equities charts, the 40-week moving average was last week's close. This week, the S&P 500 finished all the way down at the bottom of the recent range.
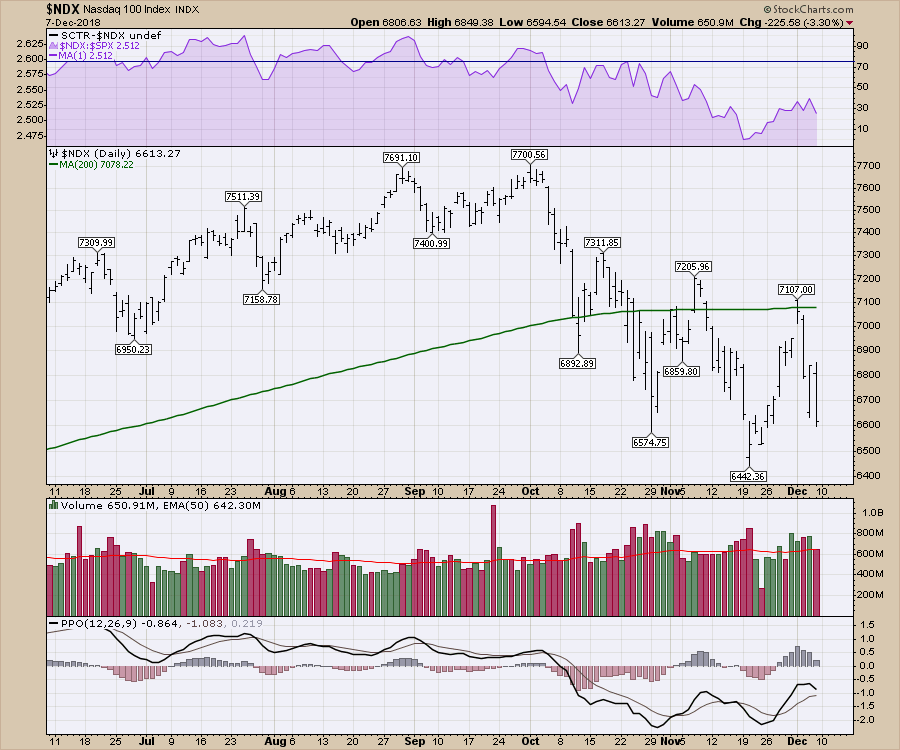
 The NASDAQ 100 ($NDX) has a similar range trade going on. The daily chart below illustrates this tension. The light volume on Friday might suggest the selling is exhausted; we'll be monitoring that over the next week.
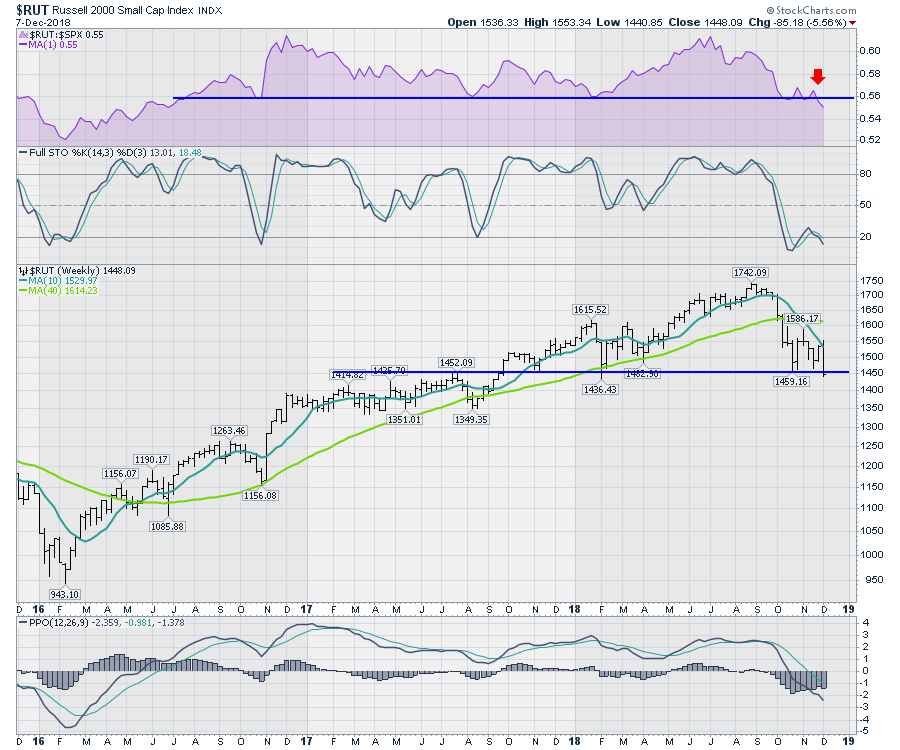
 The $RUT is the chart that concerns me the most out of the indexes. The relative strength is breaking below the range of the big uptrend of 2016. That is not a good sign.
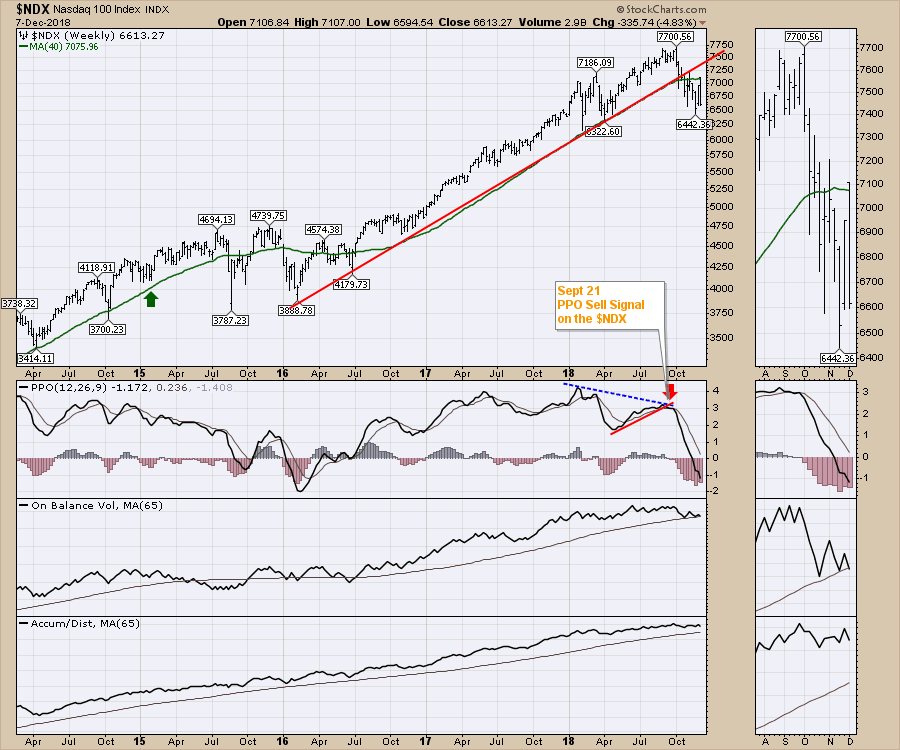
 One of the other cautionary indicators is the 65-week moving average on the $NDX 'on-balance-volume:'
 In the video, I work through the equity bullish percent charts. (There is a lot of information there.)
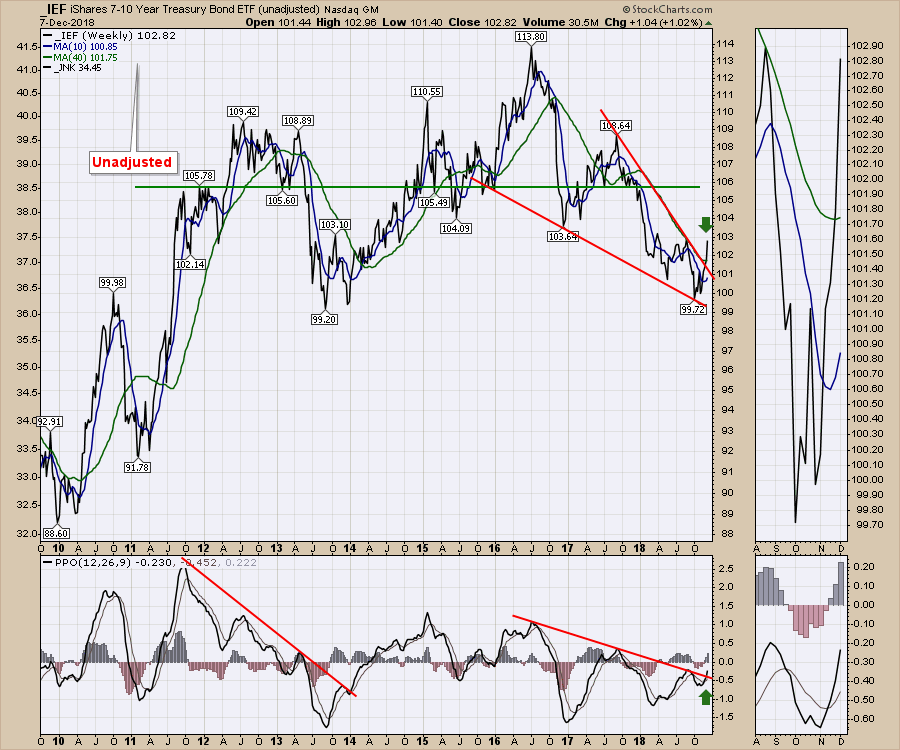
The next few charts are about bonds. The first is the 7-10 year bond ETF (IEF). The unadjusted box means the dividends have been removed from the price chart. The PPO is also breaking the downtrend. This move is just getting started.
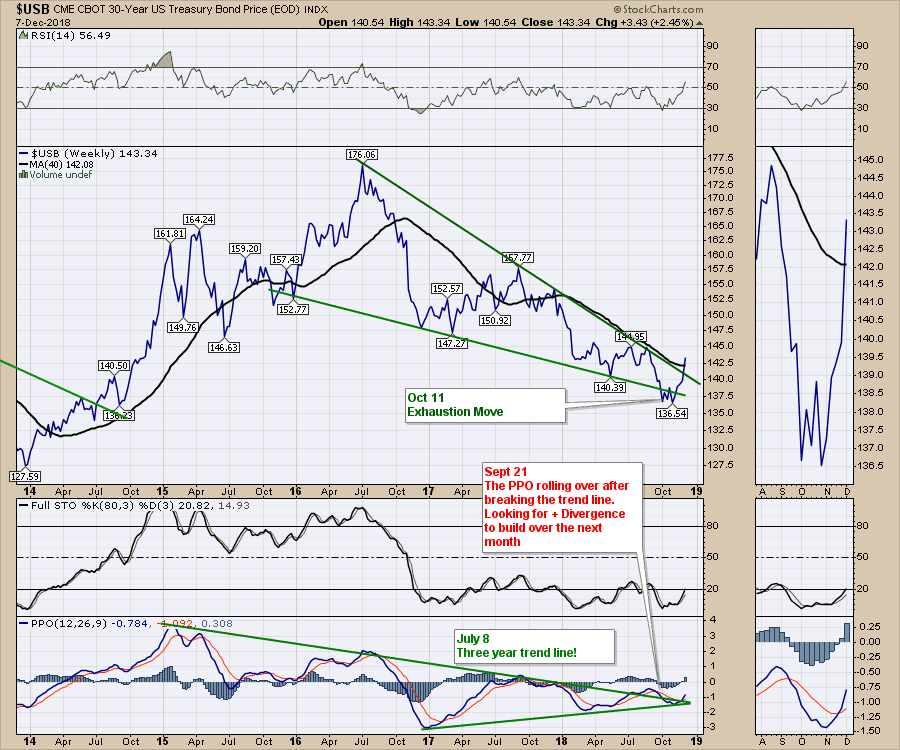
 Here is the 30-year bond price chart ($USB), which is also breaking out:
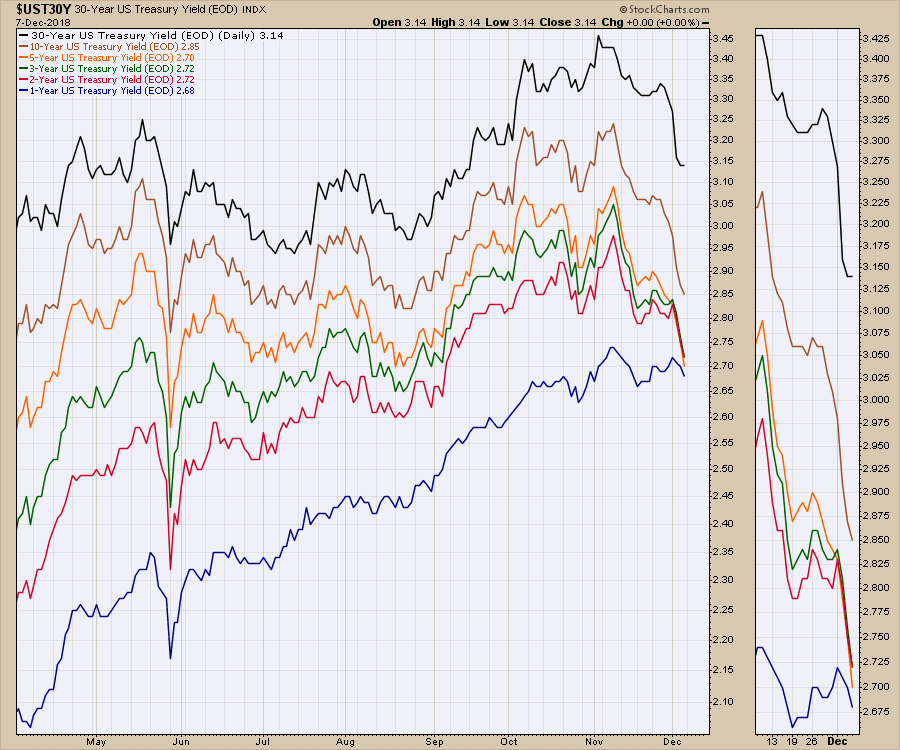
 Lastly, the yield curve chart compressed more this week:
 For more information on the bond charts, today's video has some specific comments on the 10-year.
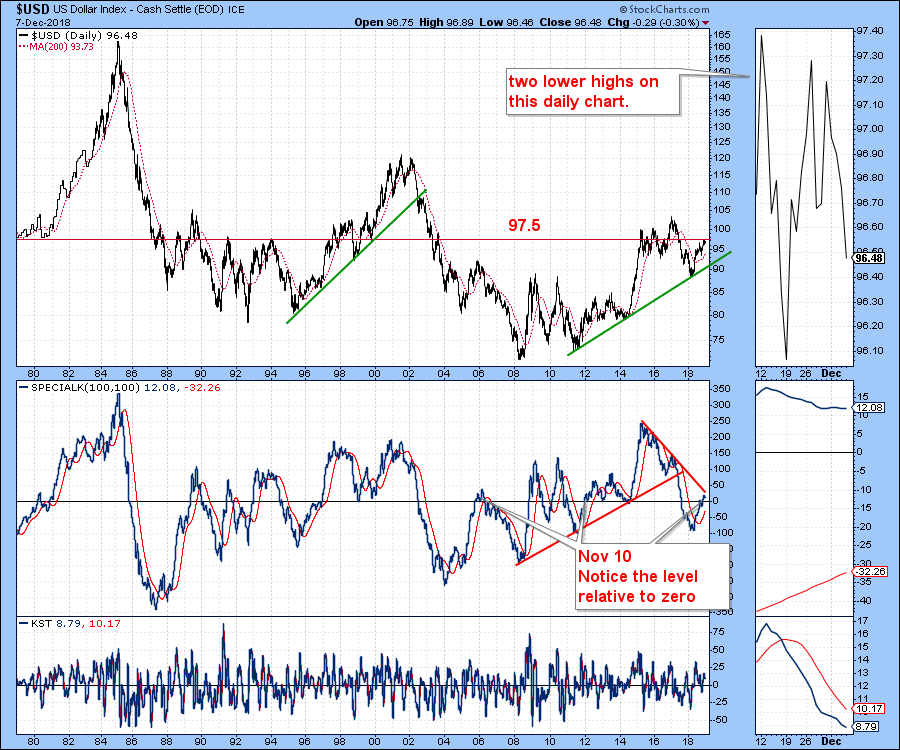
The $USD is rolling over at 97.5. You'll notice that, on this weekly chart, the PPO is turned down. The KST is also hanging above a sell signal.
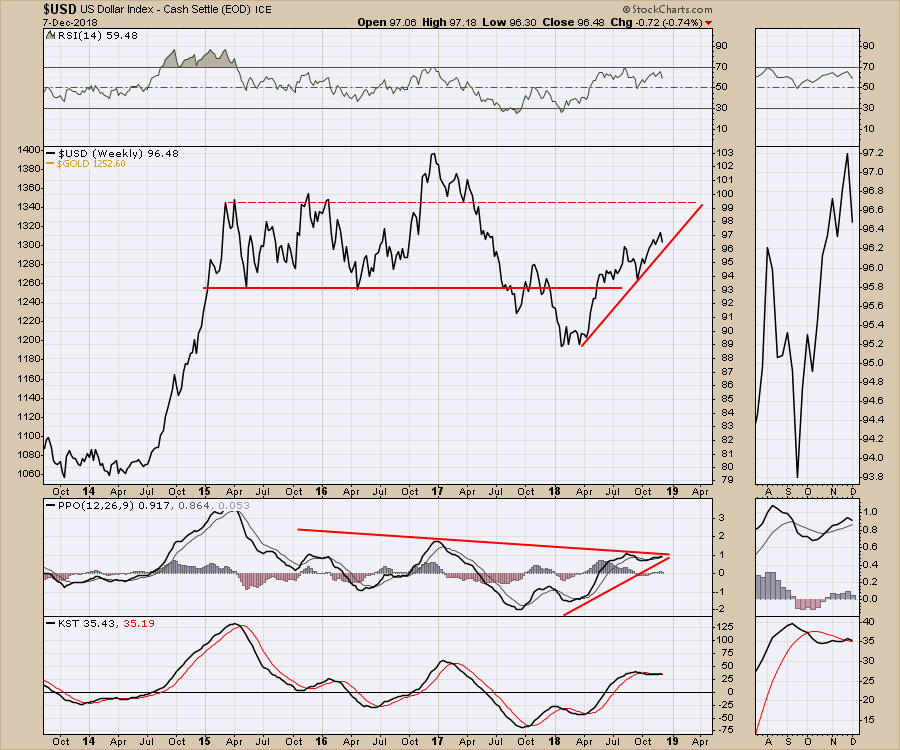 I have been focused on this 97.5 level for a long time, as those of you who have watched some of the previous videos should be aware. The chart below shows how important this level is. You can also see the two lower highs on the daily chart just under the 97.5. The Special K indicator is Martin Pring's design. The trend lines on the Special K are very important. Currently, the Special K line is trending down for two years. If it turns further down from this low level, that would probably mark the start of a larger move down for the $USD.
If the $USD is going to break down, we would expect precious metals to move higher. Gold really accelerated this week as the dollar made the second lower high.
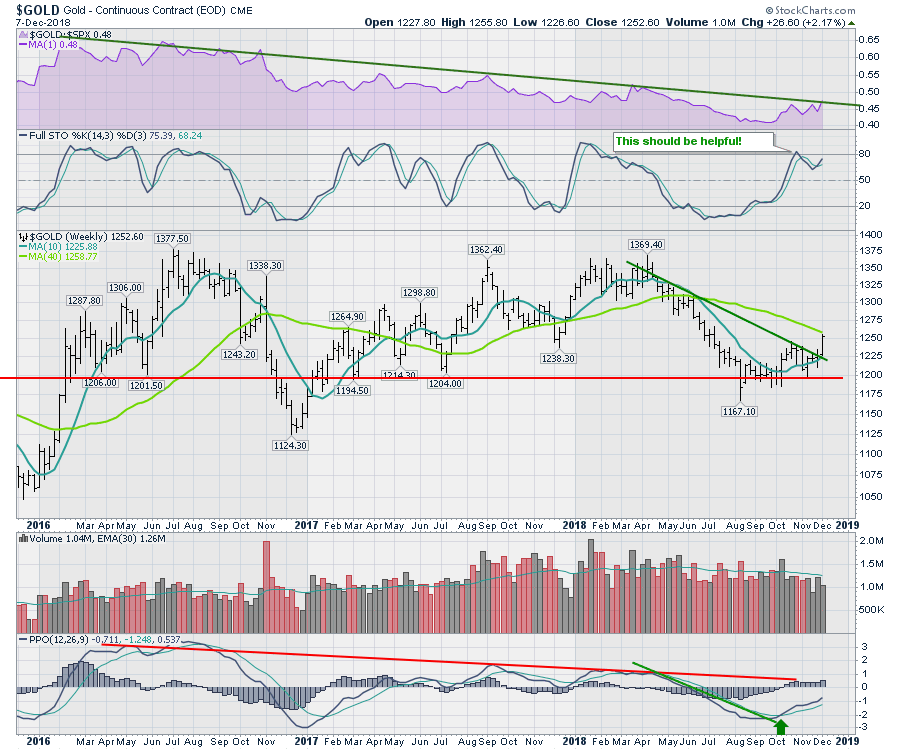 I have been discussing the gold setup for weeks now, but the breakout is just getting started. In the video, I work through gold and would encourage you to view this setup in detail.
Below is a video produced this week by our video producer Gretchen Pitluk and narrated by Erin Swenlin. I found it very informative, so I thought I would share it here.
For those of you who are looking for a small gift, you might have family or friends that would like to learn more about the basics of charting; if so, they'll love Stock Charts for Dummies. The first section of the book walks through all the chart settings to get the charts you want, while the second section explores why you might use charts for investing and the third section is about putting it all together.
Click here to buy your copy of Stock Charts For Dummies today!
This Final Bar video shows three simple scans users can work through to help find strong stocks off of the lows.
If you are missing intermarket signals in the market, follow me on Twitter and check out my Vimeo Channel. Bookmark it for easy access!
Good trading,
Greg Schnell, CMT, MFTA
Senior Technical Analyst, StockCharts.com
Author, Stock Charts for Dummies
Hey, have you followed me on Twitter? Click the bird in the box below!
Want to read more from Greg? Be sure to follow his StockCharts blog:
The Canadian Technician
