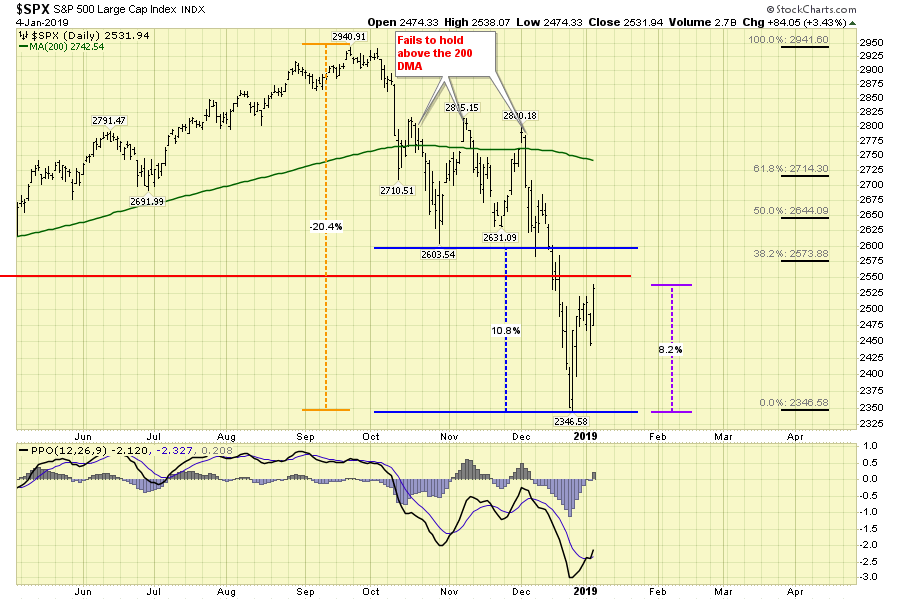
- The market bottom on December 24th looks is now support
- Friday, January 4th marked a follow-through day
- Bonds reached an inflection point
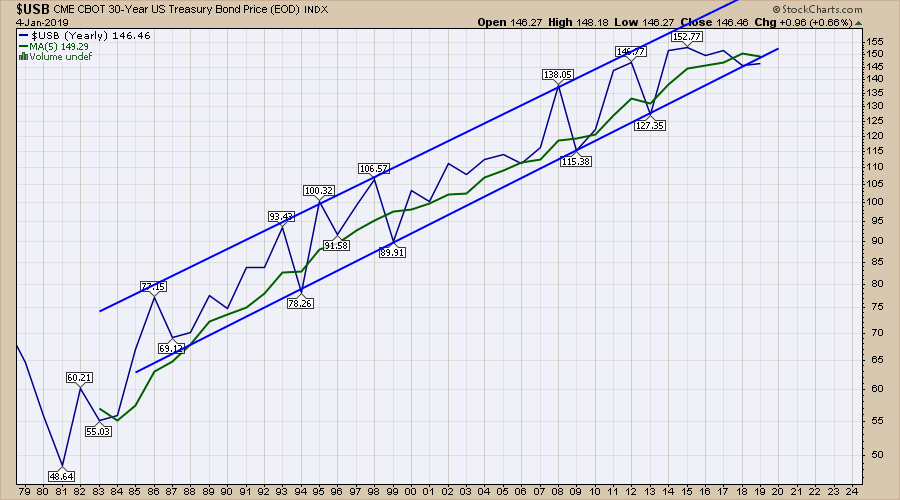
- The 30-Year Treasury closed out the year inside the annual channel
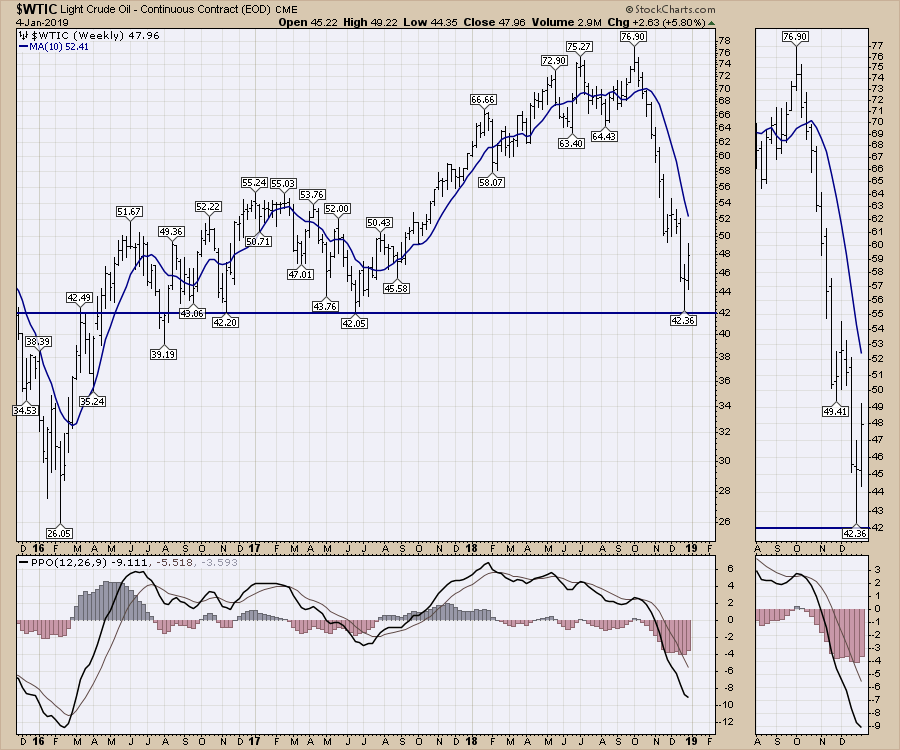
- Oil bounced off 2016 and 2017 support levels
First off, the gift of Christmas 2018 appears to be the market bottom. December 24th saw a down 1/2-day, with a ripping rally on December 26th.
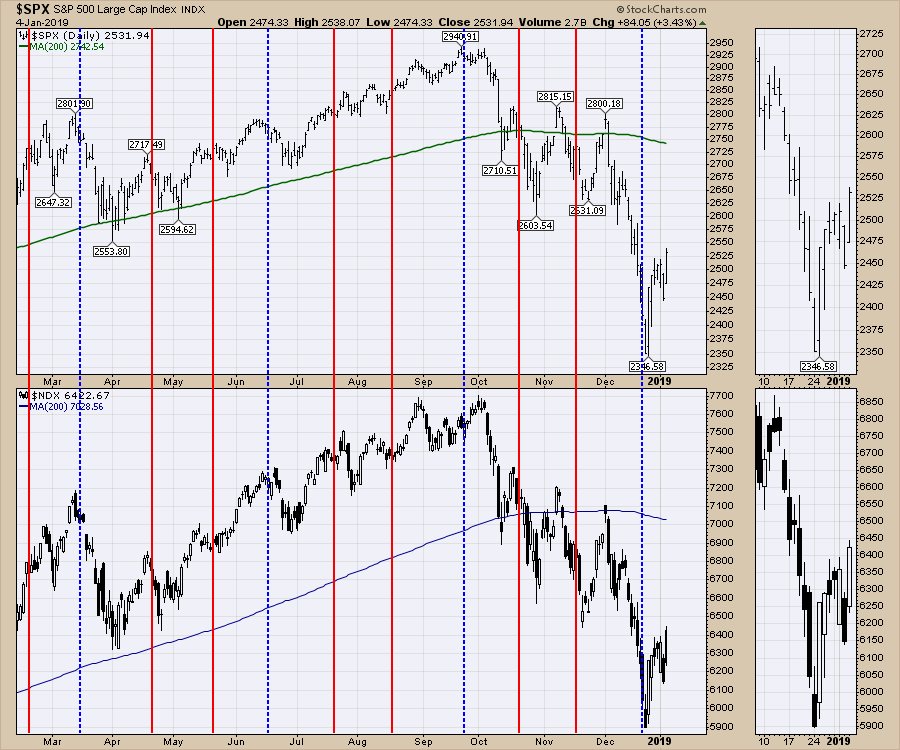
 I think it is important to note that all this came after the quarterly options expiration quadruple witching, shown with a blue line. The market top also occurred at a quadruple witching date. I mark the options dates on my chart as the year unfolds. Sometimes they're helpful, sometimes they're irrelevant, but they can mark key inflection points.
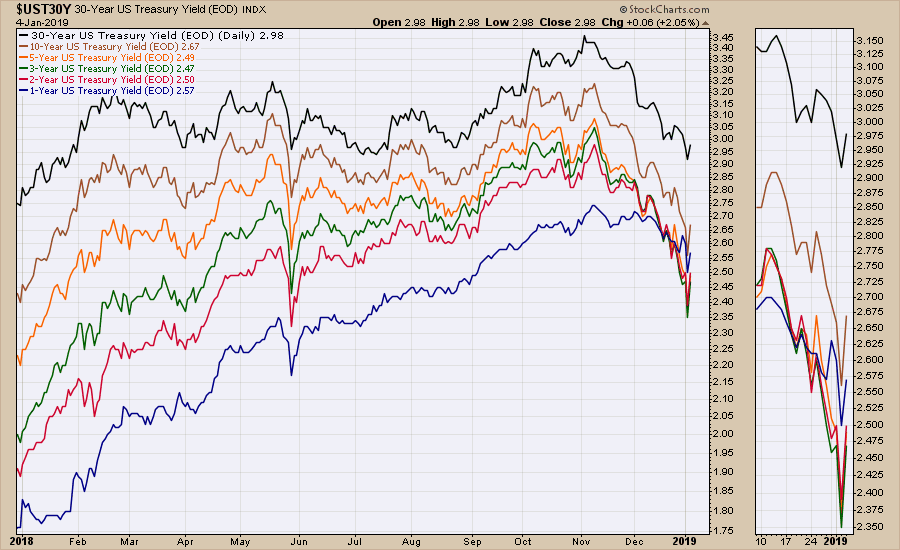
Rolling into the bond market, the thirty-year bond price closed right on the channel line for the 30-year trend. It has wandered back out of the trend in the first few days of the year.
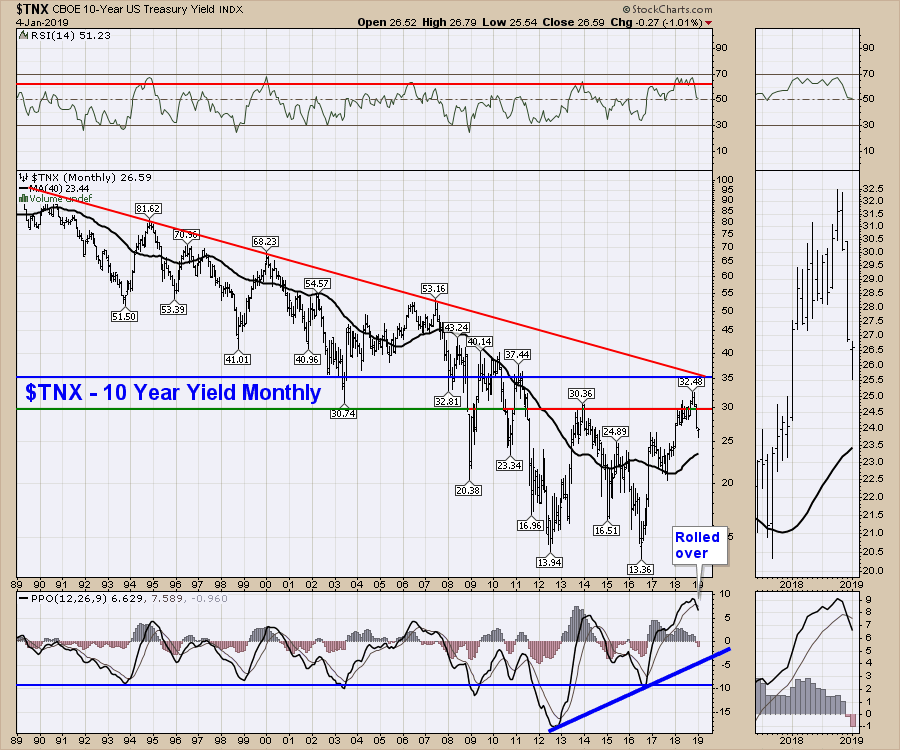
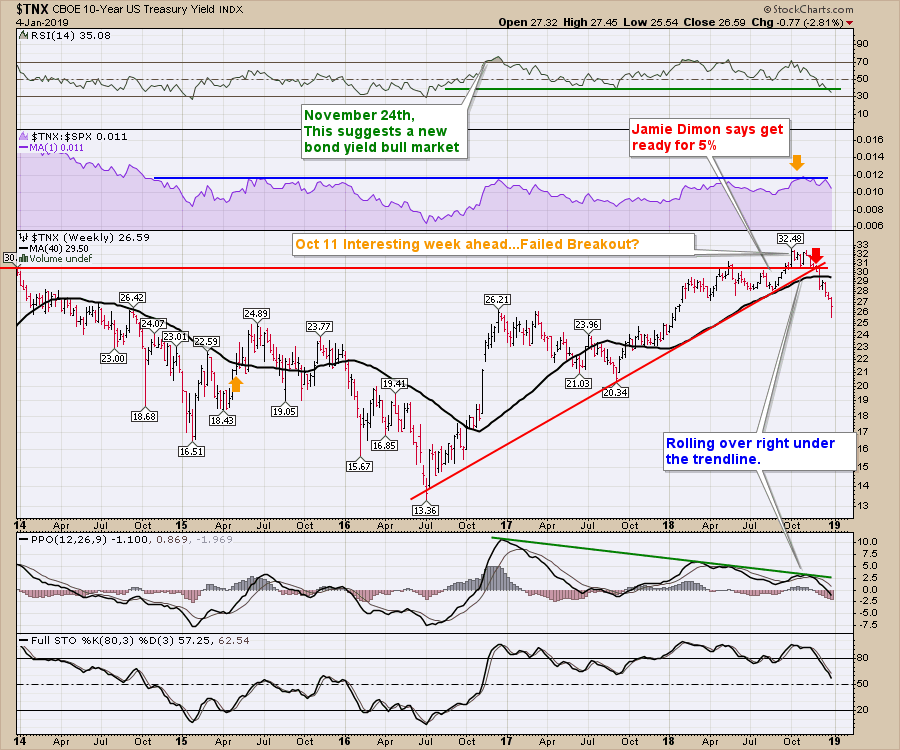
The monthly ten-year $TNX chart momentum indicator (PPO) rolled over to close out the year. I think this is very significant. The momentum indicator only has five tops above zero in 30 years. While the tops don't usually overlay with the equity markets perfectly to the month, it's not a random event that the PPO tops in 2000, 2006 and 2014 marked early warnings for changes in the equity markets as well.
 The weekly ten-year $TNX continues to roll down.
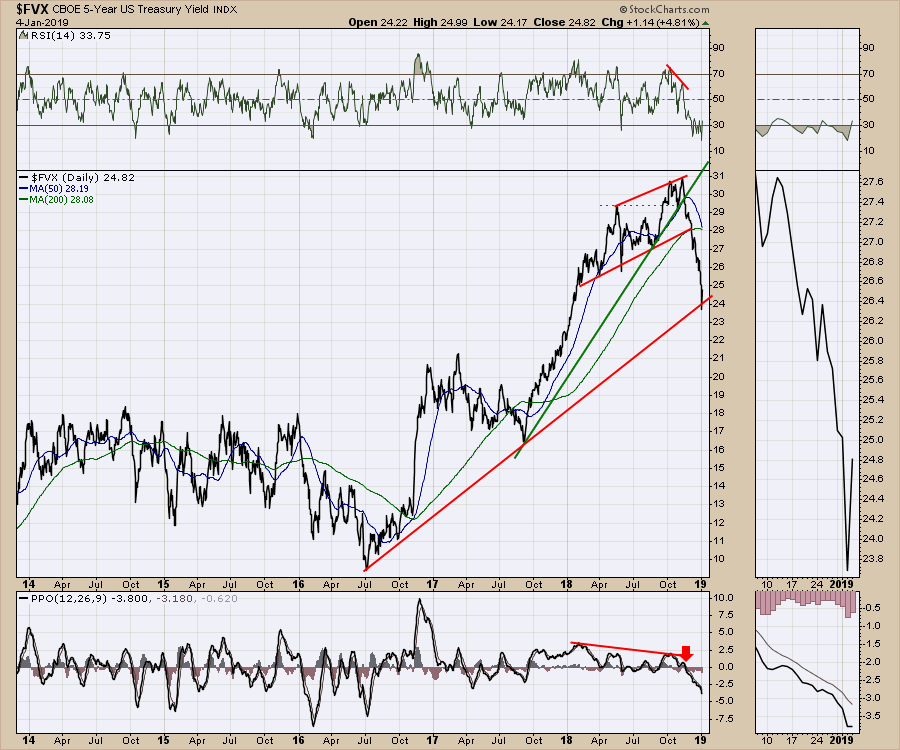
The five-year daily $FVX bounced at an important trend line.
Reviewing the spreads, they still show the 2-, 3- and 5-year yields below the 1-year yield. This is an inverted bond market. However, the market is typically focused on the 10-year (brown) vs. the 2-year (red). These two specific periods are not inverted at year-end.
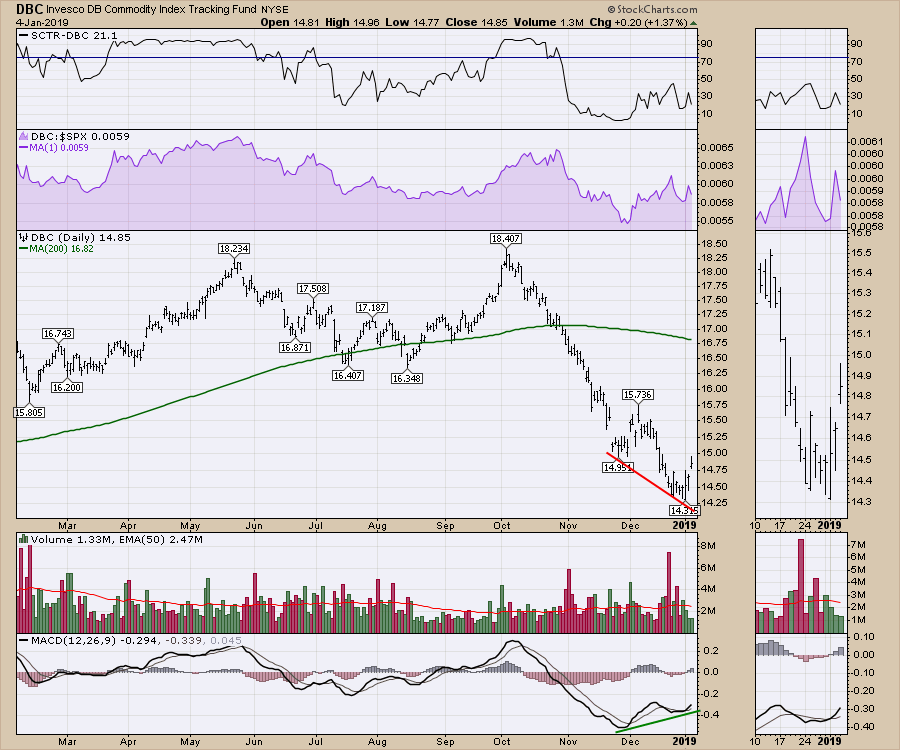
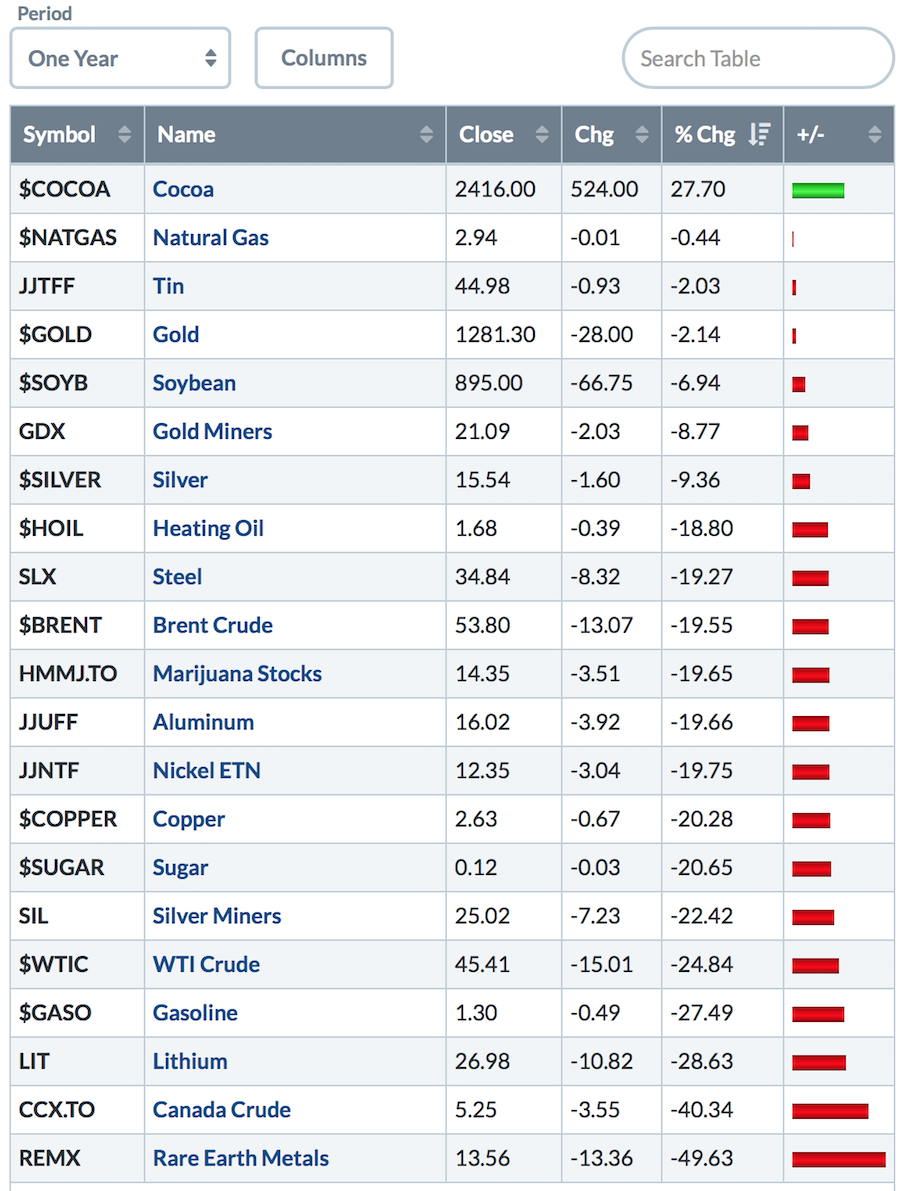
Commodities gave us some divergence on the lows! That's a positive after the giant flush of December.
Crude Oil ($WTIC) bounced off $42. That is an important low that was tested in 2016 and 2017. I also like that it was a low that had positive divergence on the momentum indicator (PPO) on the daily. The weekly chart looks severe, but crude oil can make V-bottoms like in 2016. We'll need to watch this over the next few weeks to make sure it holds up.
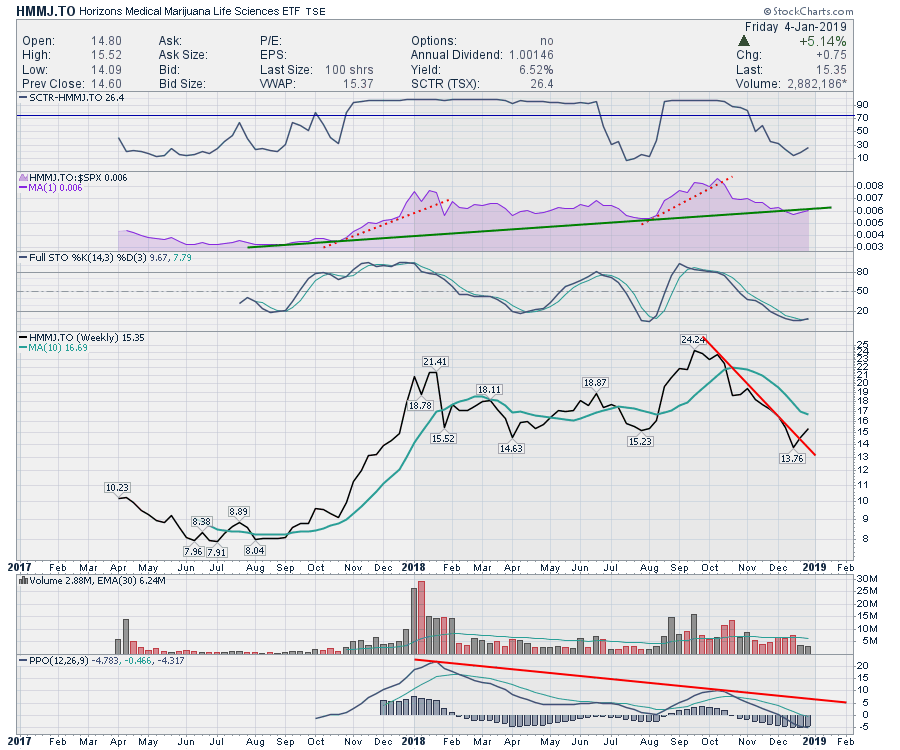
While Marijuana is a new industry, it has already been in and out of some significant rallies. This week, a trend break happened once again, to the upside. The chart shows the relative strength of the marijuana ETF, slipping just below its trend line on the purple area chart. Below the 10-week moving average, it's a volatile trade. All that is to say that, because of the bounce in the overall indexes, I would want to be long. If the relative strength does not resume its outperformance, I would be staying away from the industry. How many new industries do we see initially outperform, then need a year or two to rest? Internet security stocks and bitcoin are two significant areas that soared only to lose their mojo. Stay cautious if working this trend, as it did make a new 52-week low in price. Those 52-week lows are not usually seen in uptrends.
Here are the final levels for Commodities for 2018:
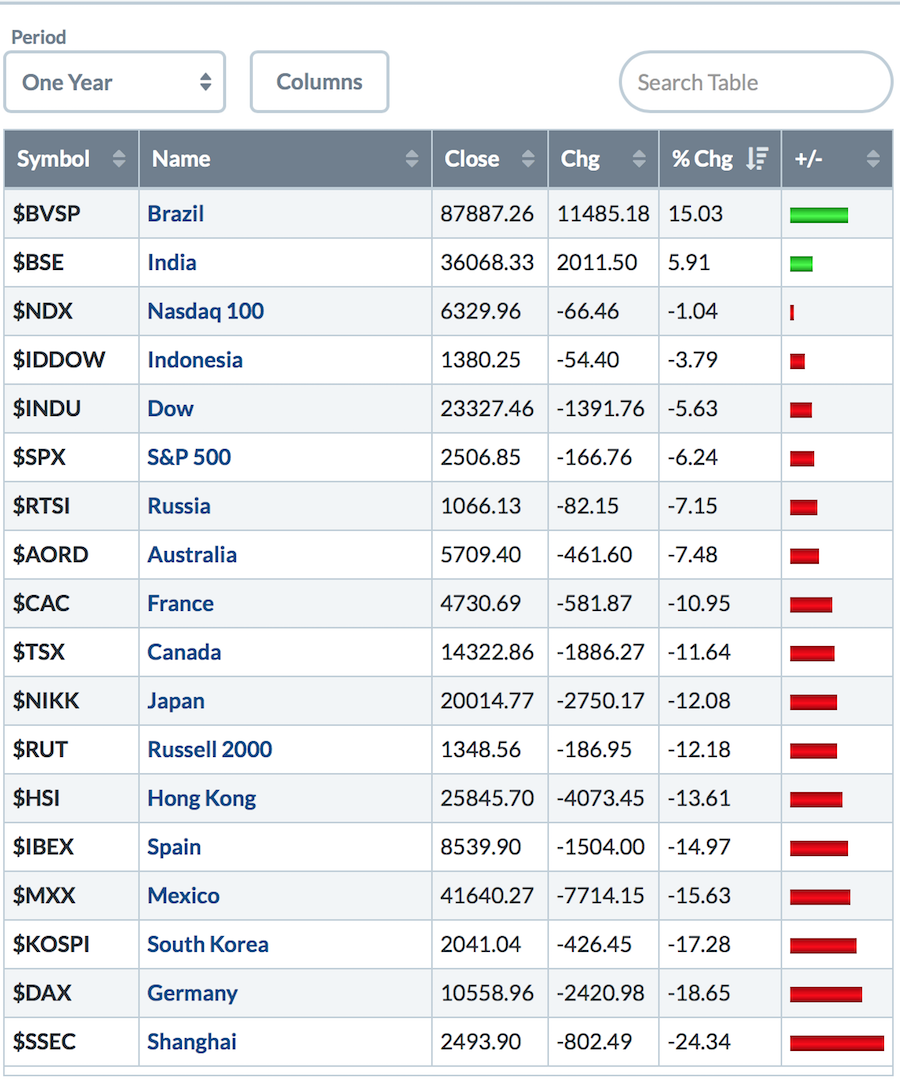
 The final levels for the global indexes:
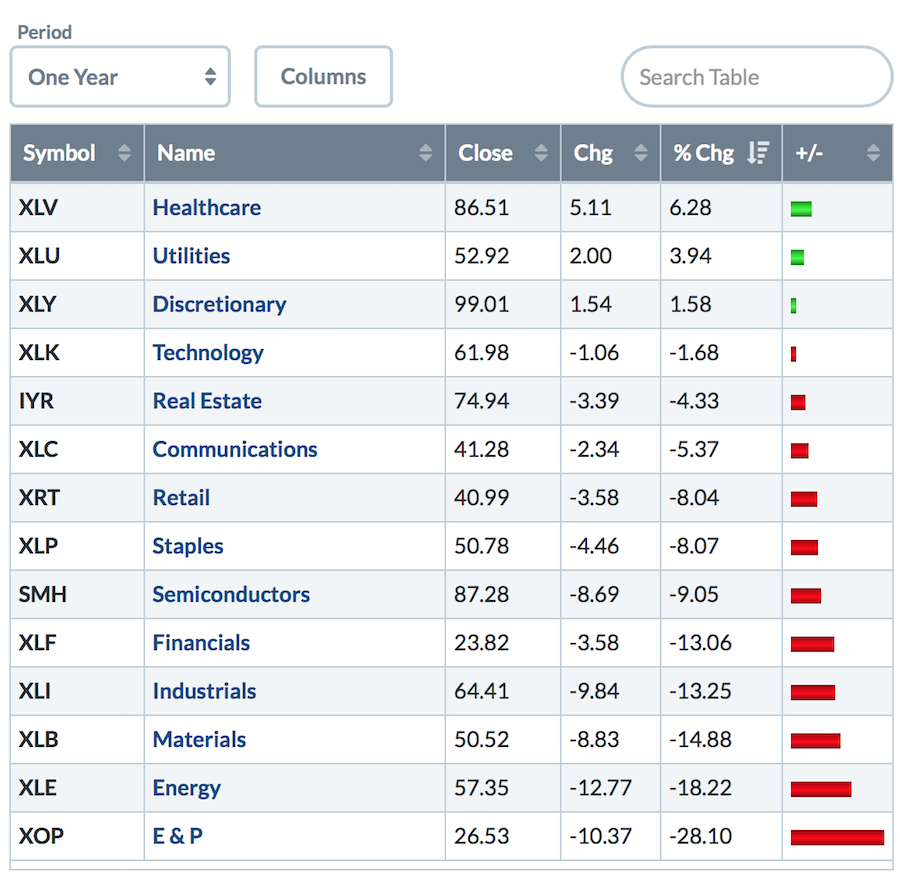
 The US Sectors for 2018:
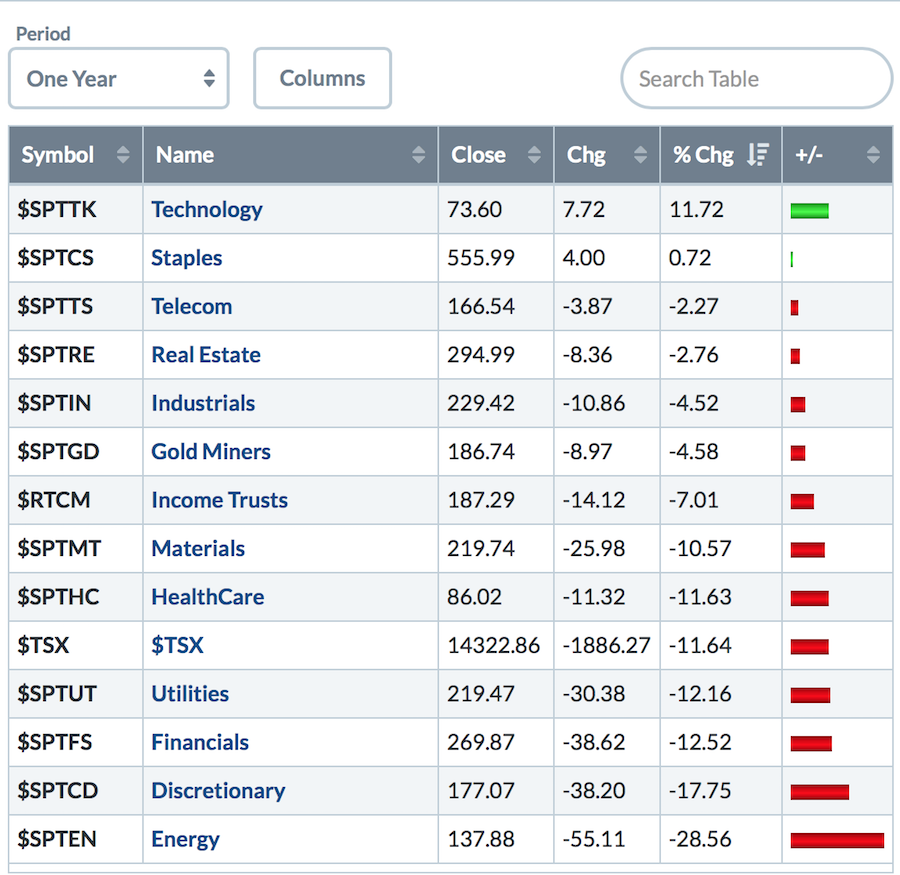
 The Canadian Sectors for 2018:
Lots more on this weekend's market wrap:
On The Final Bar, I mentioned a lot of negative sentiment indicators. If you are not familiar with sentiment indicators, you may find this video helpful. There are some other charts to take note of as well.
The Canadian Market Review goes through the significant breakdowns on the charts and what to look for.
If you would like to learn more about the basics of charting, check out Stock Charts for Dummies. The first section of the book walks through all the chart settings to get the charts you want, the second section explores why you might use charts for investing and the third section is about putting it all together.
Click here to buy your copy of Stock Charts For Dummies today!
If you are missing intermarket signals in the market, follow me on Twitter and check out my Vimeo Channel. Bookmark it for easy access!
Good trading,
Greg Schnell, CMT, MFTA
Senior Technical Analyst, StockCharts.com
Author, Stock Charts for Dummies
Hey, have you followed Greg on Twitter? Click the bird in the box below!
Want to read more from Greg? Be sure to follow his StockCharts blog:
The Canadian Technician
