I recently wrote a paper for a presentation to my industry peers about watching the investing attitudes of people trying to make money in the recent marijuana move. While I don't think the paper got published, I learned a lot from writing it. Within just a week, the traders went from mild interest to a full-on 'just buy, don't think' attitude. The market then ran up 50%-1000% on individual stocks with few people having a sell strategy. Regardless of experience level, the people at the top seemed to expect that there would be an exit sign that would have helped them get out with maximum profit and that they would 'just know' when that moment arrived.
The article went on to discuss how any bearish comments were quickly overridden by answers like "You are not going to crash my profit party!" and others. As new marijuana stocks continued to soar each day or week, every investor was noticing how fast and far other stocks were moving and expected their stocks to do the same. After huge gains, the date of legalization in Canada approached and most investors expected the stocks to continue to double and triple. Yet, within a week following the legalization date, many traders had abandoned their positions with huge losses. They also used other strategies and moved them mentally into long-term holds for their retirement account rather than sell a loser. Others reported needing to go back to work and get a different job. Some had blown up all their trading capital. The reality is a high percentage of the traders were unable to capture any profits in the massive move up from August to October 2018. While they had profitable positions, they had an exit strategy that they couldn't use, because they didn't think the run was anywhere near over. The down move was so severe that they were blown out and, subsequently, they felt the trade had to become a core holding.
Just recently, in January 2019, Marijuana stocks started another run. Whew, the investors sighed, as it would return some of the capital back into their portfolios. For all of the investors involved in the spirited move, congratulations! The really important thing in these schizophrenic moves is having a plan for capturing the gains. While you might exit too early, at least you'll have massive gains.
The reason I am writing about this while the names are still surging higher is to hopefully help some investors create an exit strategy for parabolic moves. It will never top tick the move, but it is a lot better than guessing.
One of my suggestions is to use relative strength. Huge numbers of books have been written on relative strength, so I won't get into covering it here. You can read this article on Relative Strength.
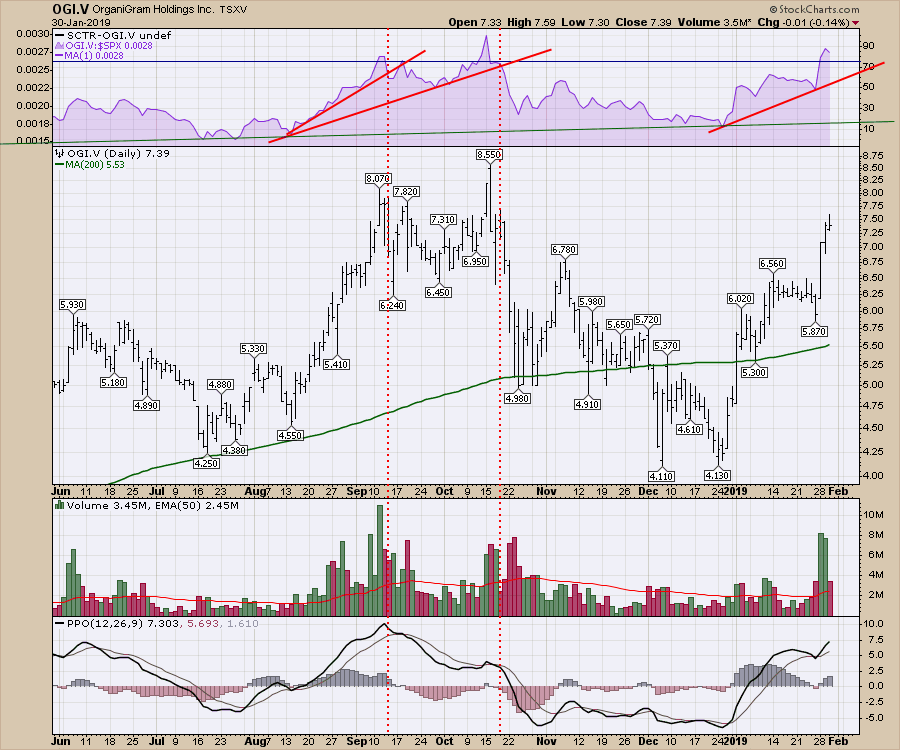
When something surges dramatically faster than the $SPX index, it outperforms. During parabolic advances in price (where the price channel arches up toward the sky), the rate of outperformance is significant. One thing I have noticed on fast moving stocks is that, when their relative strength trend breaks, it may not be the absolute stock price high, but it usually marks the point when the stock price starts to fall dramatically, as a lack of buyers becomes a problem following a huge move. If you can lock in massive gains in just a few weeks, why hold through long down periods?
On the chart below, I have dropped vertical lines where the uptrends in relative strength ended during sharp sudden moves in the August-to-October run. While the recent volumes look like initiation thrusts where new buyers are actively buying up the stock, it is hard to know for sure as some of the previous high volume thrusts were buying climaxes followed by selling, including the June 2018 period.
 On a weekly chart, the relative strength shows a macro picture. This stock is outperforming the $SPX and continues to work higher, nearing all time highs in terms of relative strength and price. What could be better?
Notice the RSI in the top panel. Each high has less strength than the previous high. This is over a three year period, so it is not a timing device, but it does suggest that each run-up has less euphoria than the previous one. We can also see that on the volume chart as well. We also see it on the PPO momentum indicator, with each high being lower than the prior high.
This chart is clearly still in a winning mode at the moment. Everything is pointed up on the right edge of the chart with no sell signal in sight. So it still is a buy. Yes, it is still a buy.
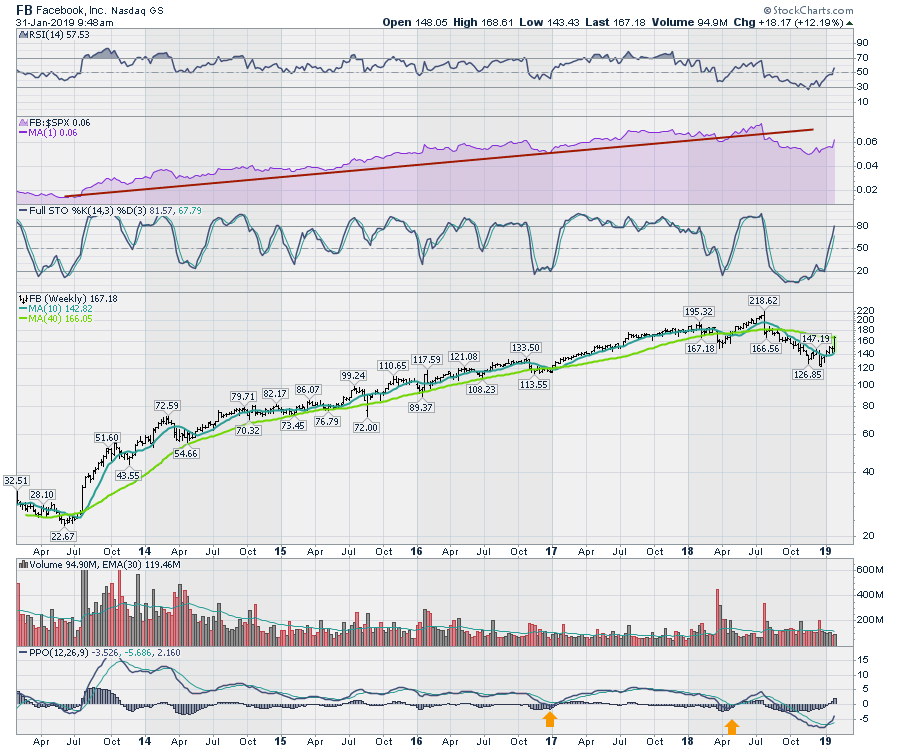
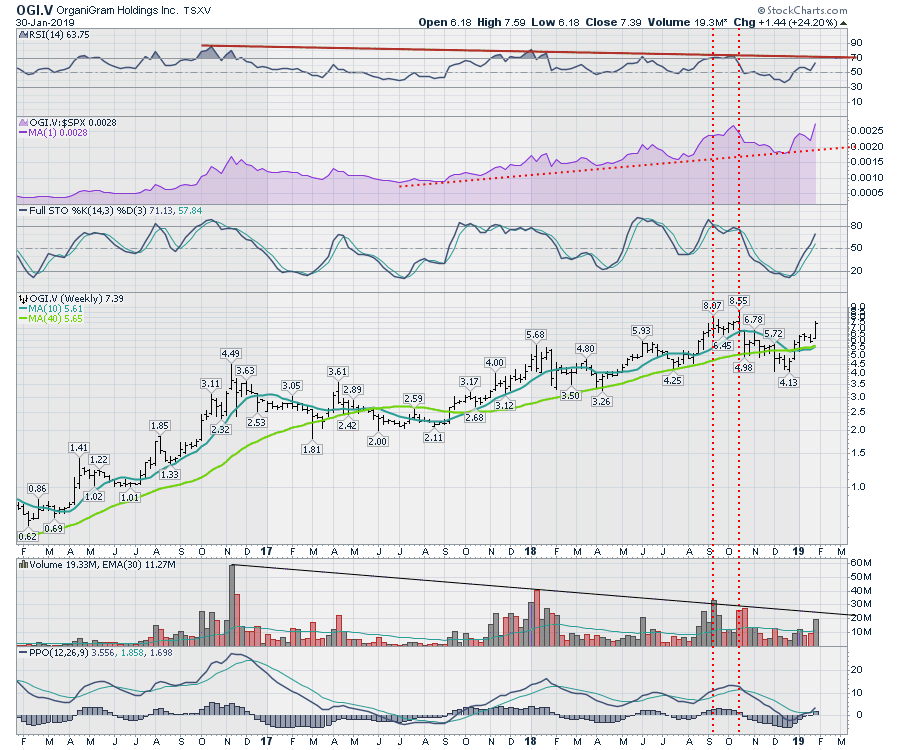 What would change my mind? Well, the PPO splashed below zero and then turned up again. When momentum has enough weakness to go below zero, I have found that the next rally may be a good exit near the highs. In the case of OrganiGram, that seems crazy. That's what happens on final highs: people expect so much more, then the stock rolls over and traps them. That adds a note of caution for me. Below is a strong stock in the news this morning on big earnings - Facebook. Notice the times when the PPO went below zero and what happened on subsequent bounces? The first time marked a resumption of the uptrend, but the second one ended up being a final high that went on to lose over 40%, going from $220 to $120. It's that cautionary note of weak momentum before that final high that can be helpful. It gives you a reason to be more aware of price action weakness. If nothing else, when the stock starts to act weak, find a way to protect your gains.
 So what's an investor to do with Marijuana names? The same with any stock. Don't get married to the future and trade the present market.
Some ideas I would suggest are:
- Use Relative Strength as a clue.
- Use the PPO as a clue.
- Use the full stochastic rolling over as a clue.
- Use a chandelier exit.
- Use a moving average for a stop.
- Use a trailing stop, with some method of moving it up as price works higher.
- Use an option to support your stock position.
Technical trading needs an exit plan to complement an entry. You will eventually run out of capital if you don't have a plan.
Again, OrganiGram is still a buy and is trending higher. But no one wanted to hear words of caution before Weed Wednesday or the legalization day for marijuana in Canada. Find a method to help you take profits when you need to.
Lastly, here is a chart showing why I wrote this article now. Below is Canopy Growth Corporation (CGC). It is one of the industry leaders and it could be a good example, so let's examine it for upside and downside. Currently everything is pointed up.
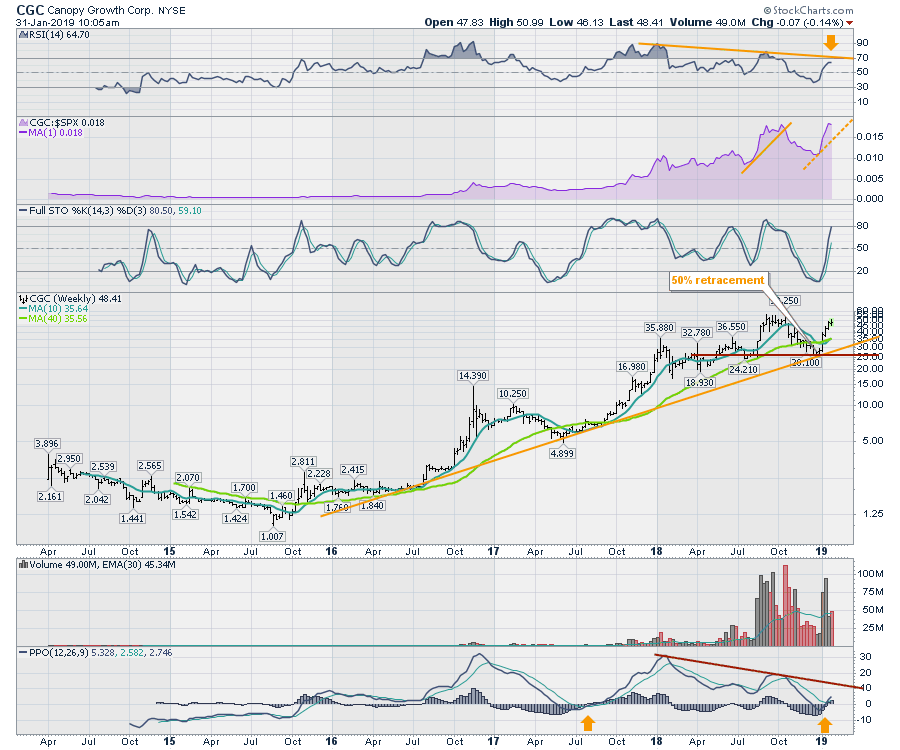
The RSI has shown some declining peaks and the current RSI is approaching the down-sloping trend. Concerning, but not a dealbreaker. The parabolic move on the relative strength is definitely worrisome, though. We have seen this movie before and it doesn't usually end well.
On the price panel, we are currently testing the previous level where price stalled for eight weeks and closed around $50. That creates the potential for a double top. Recently, the PPO made its second move below zero. It could keep running for months to the upside. Should the stock start to fail here, I don't think you want to wait for horizontal support at $25 to be your exit. You'll need something to help near the highs if and only if this stock rolls over amidst these technical clues. The yellow trend line will get you out near $30 or $35 currently, which is still a substantial reduction.
All that is to say the conditions are ripe for CGC to roll over, but it could still continue to soar. Just because a storm is on the horizon doesn't mean it will affect you. Growth stocks are notorious for being over-loved and then falling a long way. Build a plan on the weekly and daily charts to help you take some profit out of your trades, unless you're a buy-and-holder forever. In that case, you won't care about 50% wiggles.
Good trading,
Greg Schnell, CMT, MFTA.
