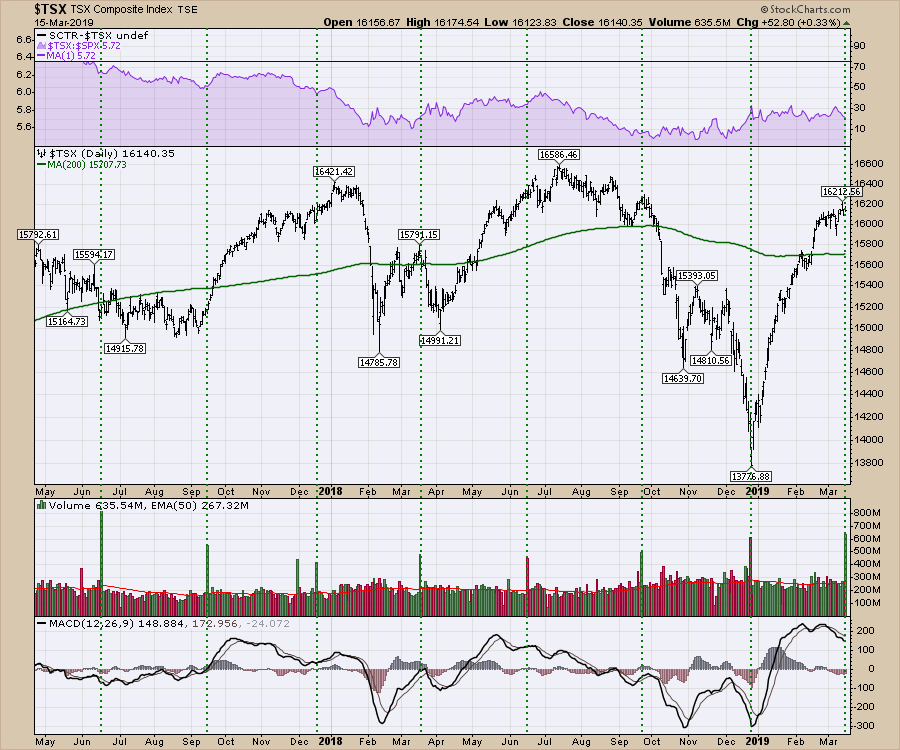
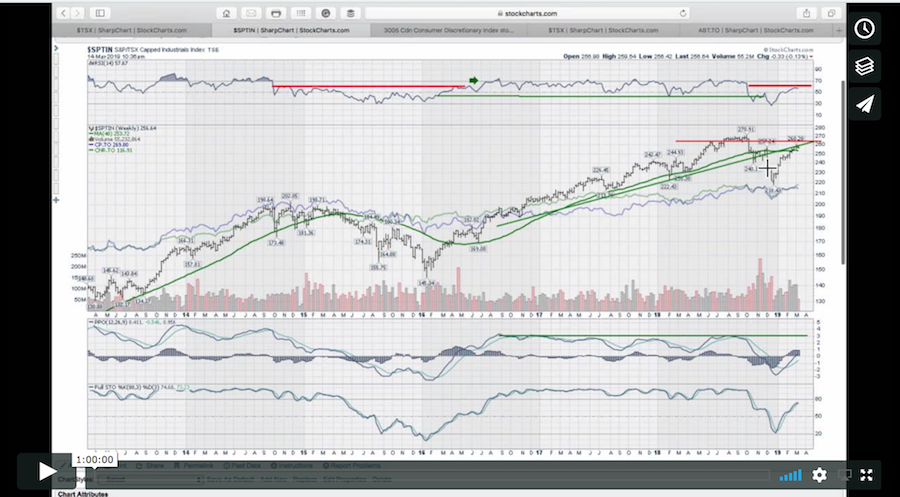
The $TSX continues to inch higher week after week, suggesting that my caution in February was unwarranted. However, this week marks options expiration, as I mentioned early in the month. While the US market seems to find these dates important, the Canadian market finds them definitely important.
- June 2017 - Market consolidates sideways after a gentle drift lower
- September 2017 - Market closes same as June OE level, starts breakout
- December 2017 - Market breaks out above consolidation
- March 2018 - Final high before a 5% drop
- June 2018 - Ends the bull market run, starts top consolidation
- September 2018 - Market drops 2500 points from that date
- December 2018 - Marks the low, starts rally of 17%
- March 2019 - With the PPO so high, I am not expecting the outcome to be higher, so my bias is down. Maybe a sideways consolidation a la June 2018?
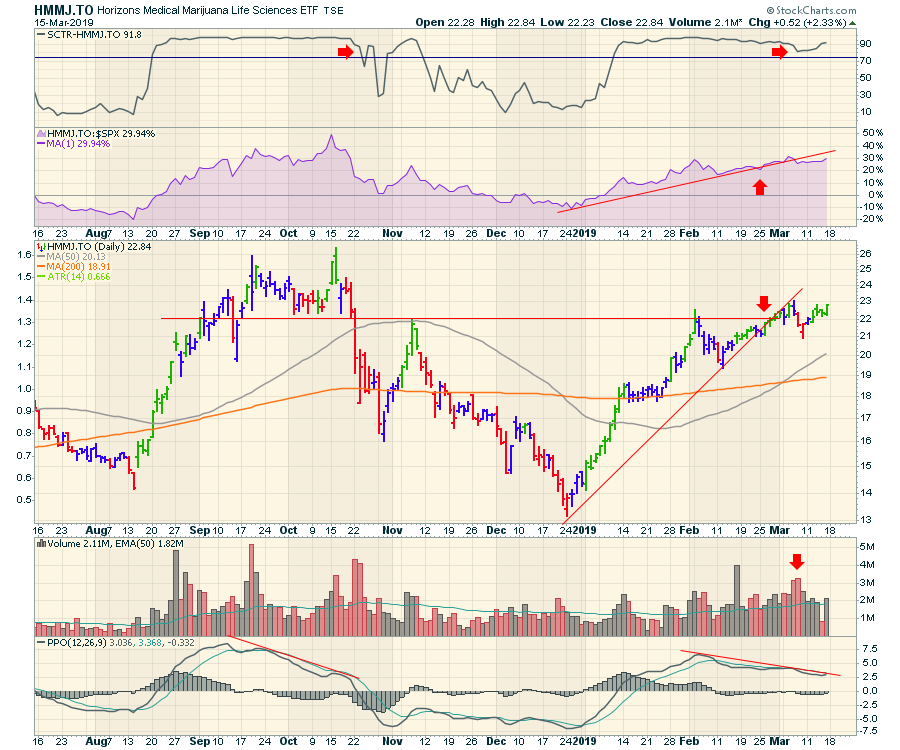
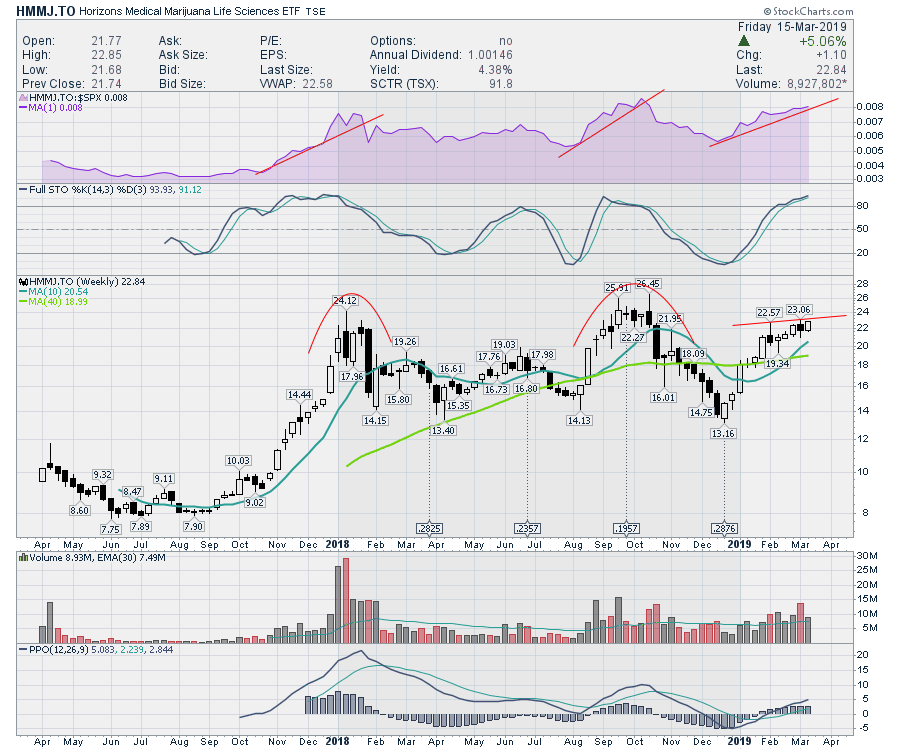
 I booked a note in my journal on February 25th, in which I expected the Marijuana names to top out. They proceeded to push higher from there. While the ETF for the group has not outperformed the $SPX, the ETF has not broken down either. After the PPO started moving lower in February, with a lower high compared to September, it looked to me that the end was near. The price action is still hovering around the $22 level and the last three days have made lows right above the line.
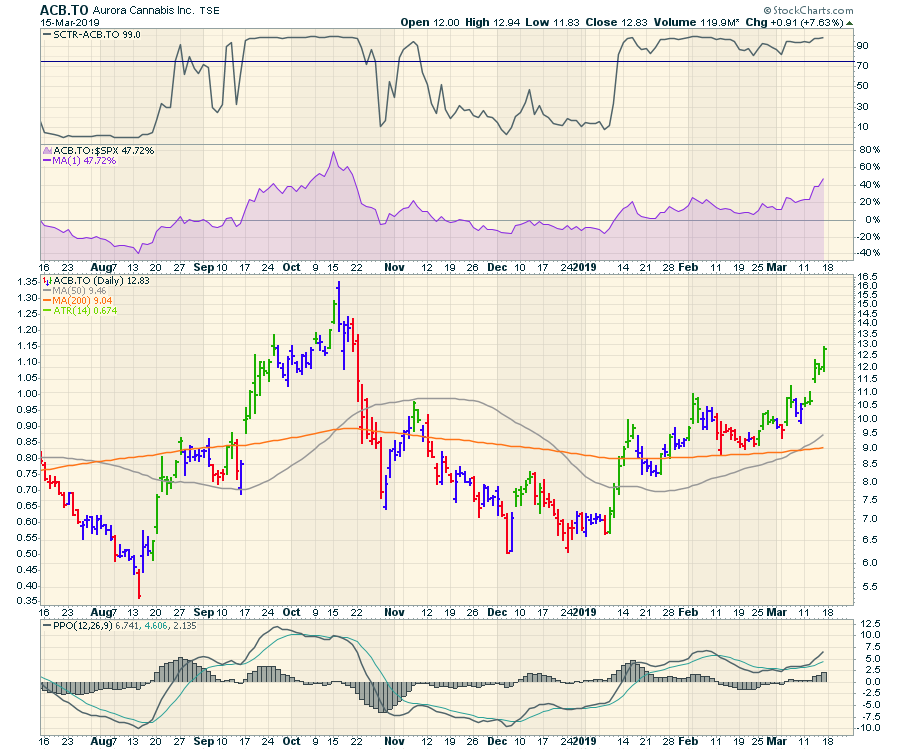
 I continue to think the end of the run is near, but the big jump in ACB.TO this week added more optimism to the industry believers. ACB.TO had a big week, up 23.7% !
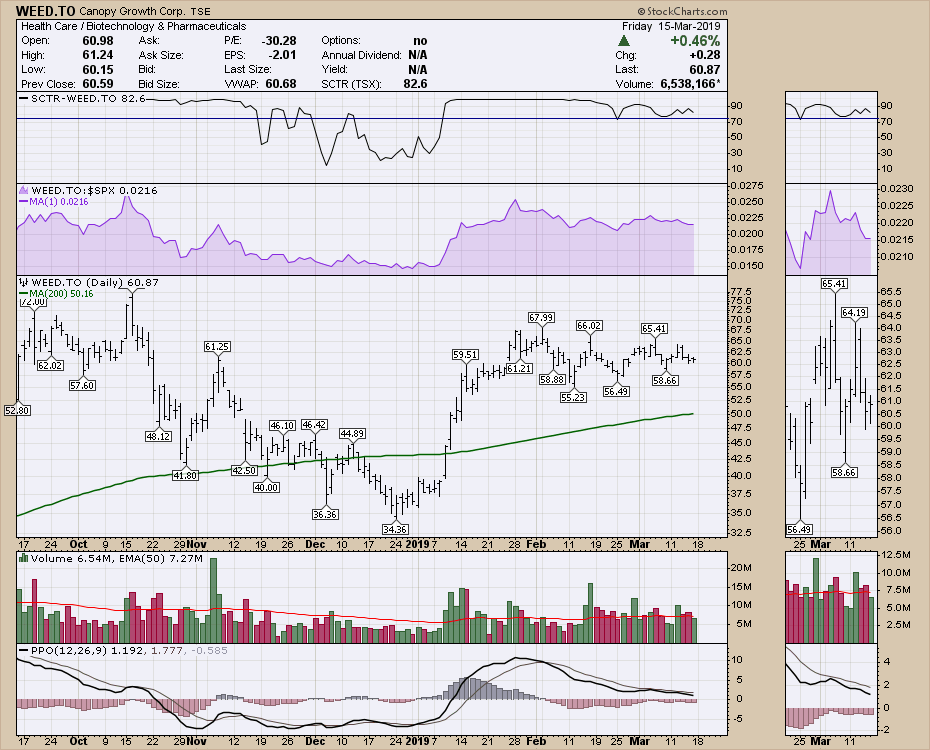
 WEED.TO moved up 0.06 cents on the week, with a Friday push of $0.28. Watching to see which way Canopy Growth wants to break is probably the biggest focus after the options expiration.
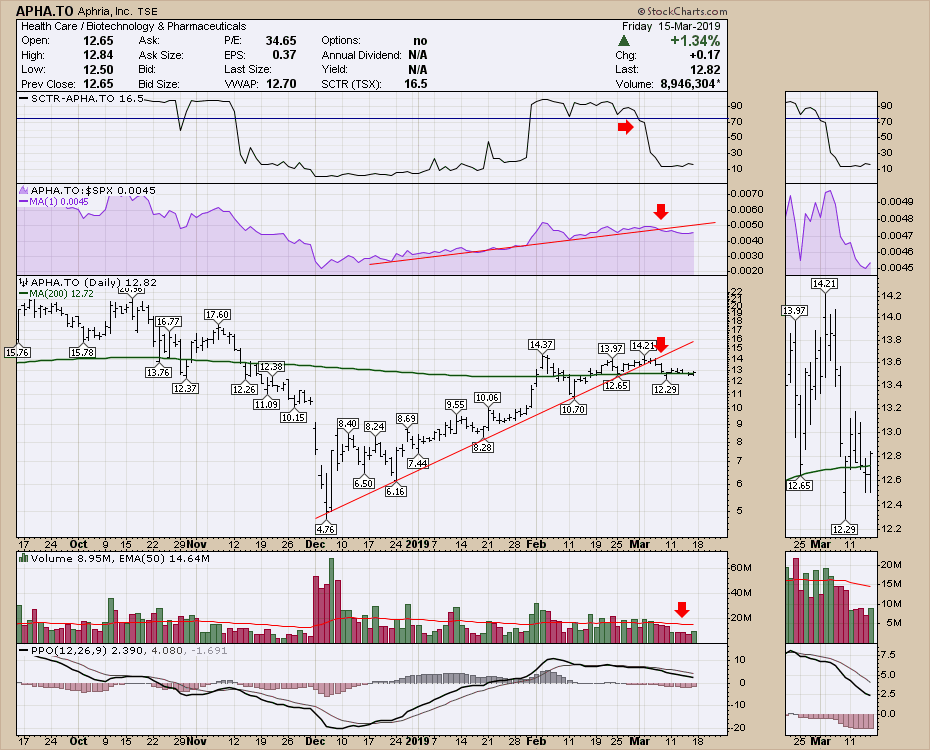
 APHA.TO also closed up 0.06 on the week, with a push on Friday up $0.17.
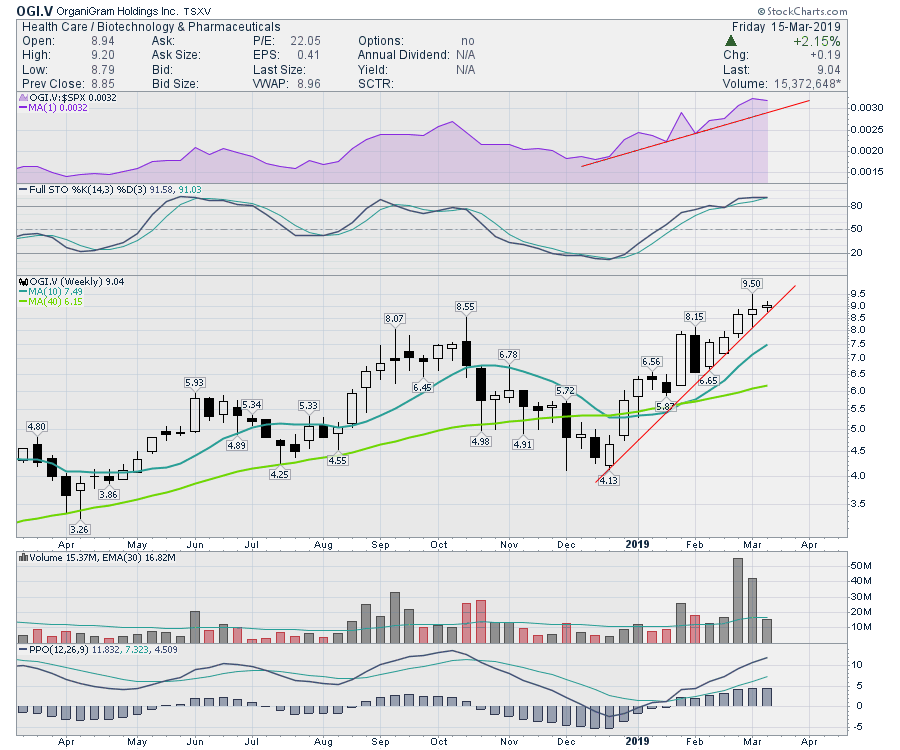
 OGI.V had an inside-week doji on the weekly chart.
 I would suggest that these stocks did not participate in the new momentum from ACB.TO. The bottom line is that I still think extreme caution is warranted. One stock was up almost 25% this week, but the ETF did not make a higher high on the week, which is notable.
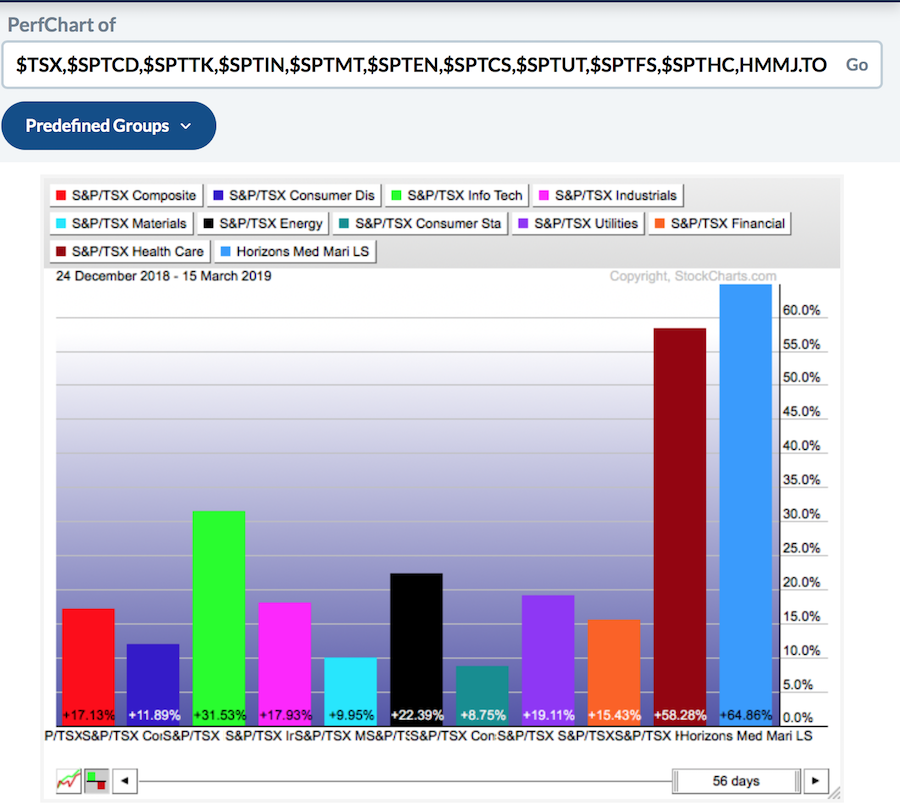
 One of the other things to consider is the individual sector performance in Canada since the Santa Claus lows. Needless to say, the healthcare sector has been a standout. The marijuana industry has been the weighty contributor to the healthcare rally. The chart below shows the sector performance as compared to the $TSX. I have added the Marijuana ETF to the end. Information tech has done well, with the $100 move in SHOP.TO.
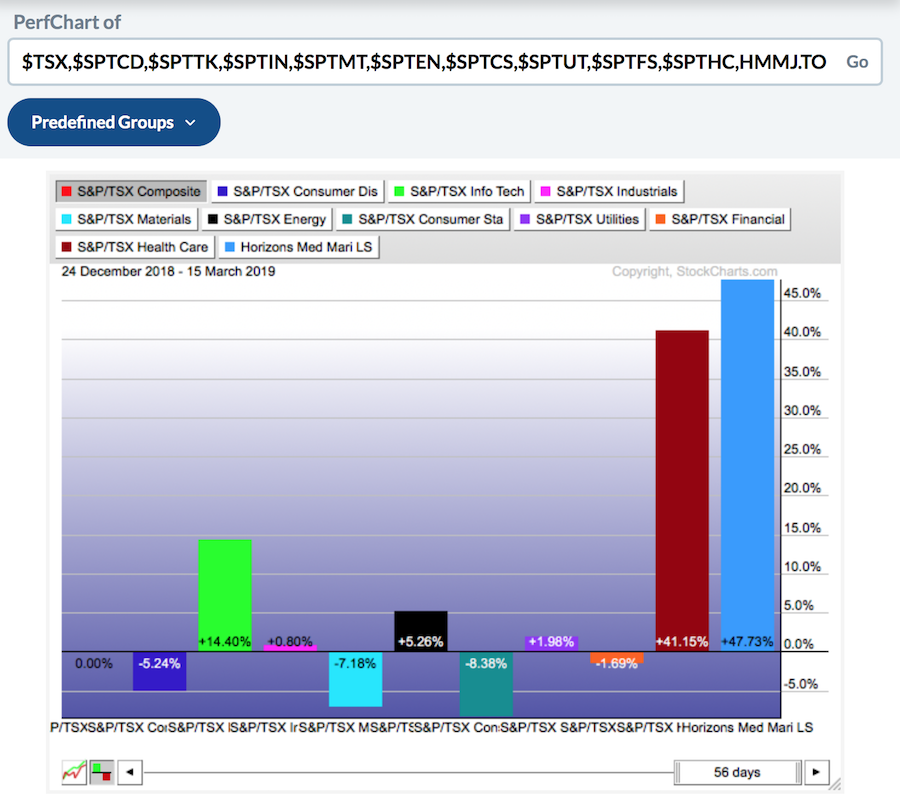 Looking at the absolute performance rather than the relative performance, we can see how each sector has done. Financials have been one of the worst performers. I think it's important to note that, without the marijuana names running, the $TSX is not exactly running away.
Thanks for checking in on my articles and videos. I noticed this week that I have posted almost 200 videos on the Vimeo channel, which doesn't even include the Market Buzz show (which is on the StockCharts Youtube channel). Bottom line: there is a lot of content every week if you're looking for some.
Here is the the Canadian Market Roundup for mid-March.
Here is a link to this week's Weekly Market Roundup, with a lot more information on the transports and the industrials.

Wednesday's Market Buzz talked about the bank stocks. Click on the Market Buzz below to watch.

If you would like to learn more about the basics of charting, check out Stock Charts for Dummies. The first section of the book walks through all the chart settings you need to help you get the charts you want, the second section explores why you might use charts for investing and the third section is about putting it all together.
Click here to buy your copy of Stock Charts For Dummies today!
If you are missing intermarket signals in the market, follow me on Twitter and check out my Vimeo Channel. Bookmark it for easy access!
Good trading,
Greg Schnell, CMT, MFTA
Senior Technical Analyst, StockCharts.com
Author, Stock Charts for Dummies
Hey, have you followed Greg on Twitter? Click the bird in the box below!
Want to read more from Greg? Be sure to follow his StockCharts blog:
The Canadian Technician
Good trading,
Greg Schnell, CMT, MFTA
