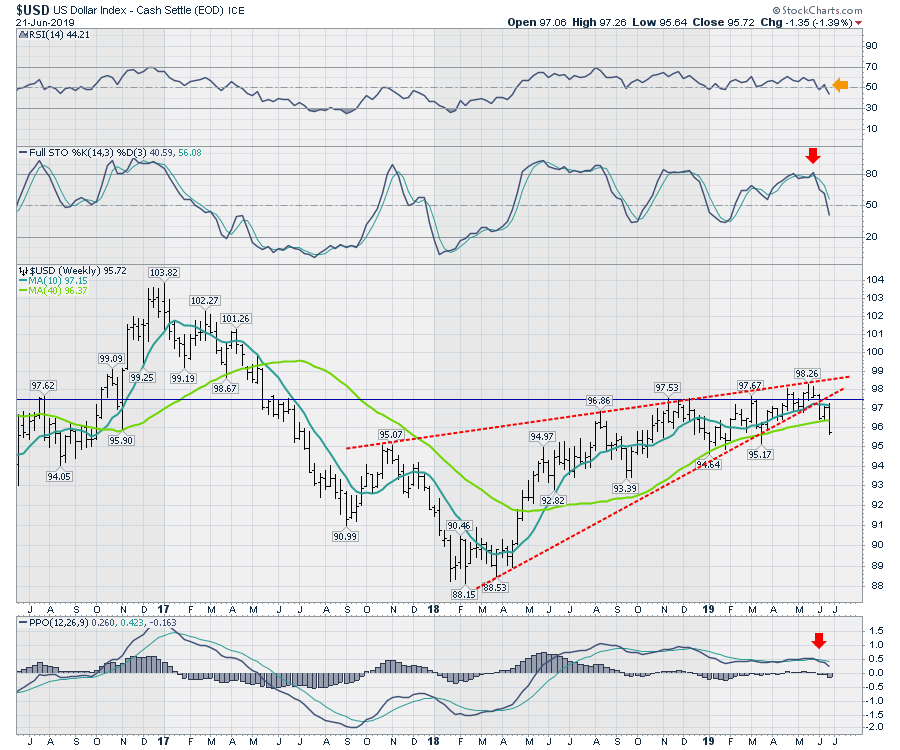
This week, the story is the confirmation of a breakdown in the US Dollar. While $USD hasn't been going anywhere fast, the attempts to get through the 97.5 level appear to be in the rearview mirror.
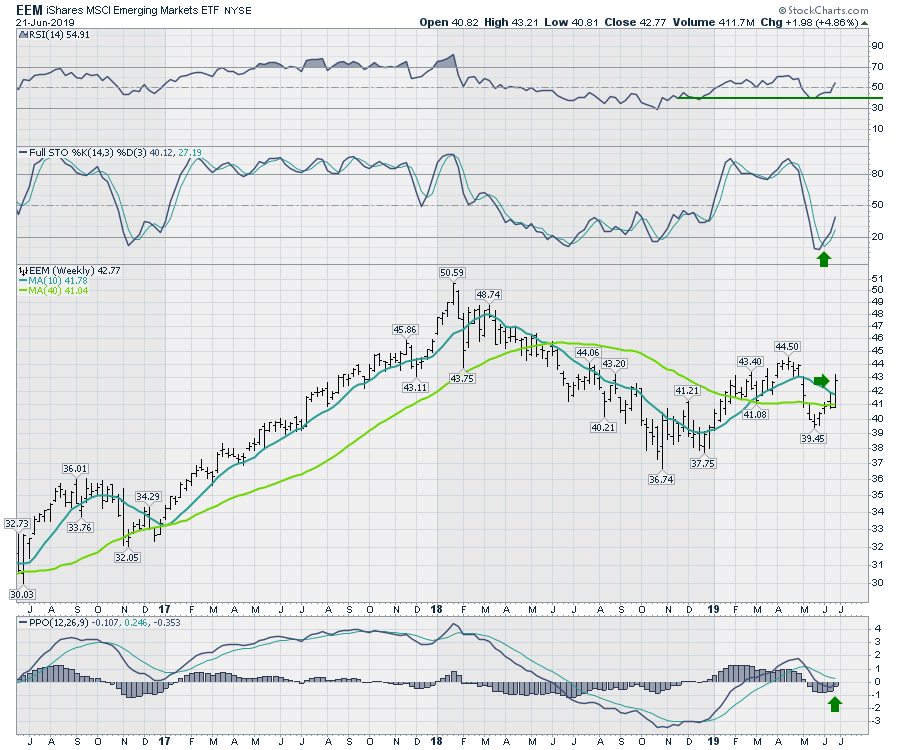
 This move is important to the emerging markets, as they tend to do well with a dropping US Dollar. One of the ideas would be to get long unhedged emerging markets. This will move up as the market moves; the added benefit of a dropping dollar can also add a little torque to the trade.
Here is a ratio of the emerging market ETF (EEM) compared to the SPY. Throughout the big bull market of 2017, the emerging markets outperformed the S&P 500 as the US Dollar fell. The chart also shows that, if the US stock market is about to start falling like in October to December 2018, this outperformance will show up too; however, that was not based on a weakening US Dollar. For me, the backdrop for this trade is the falling US Dollar.
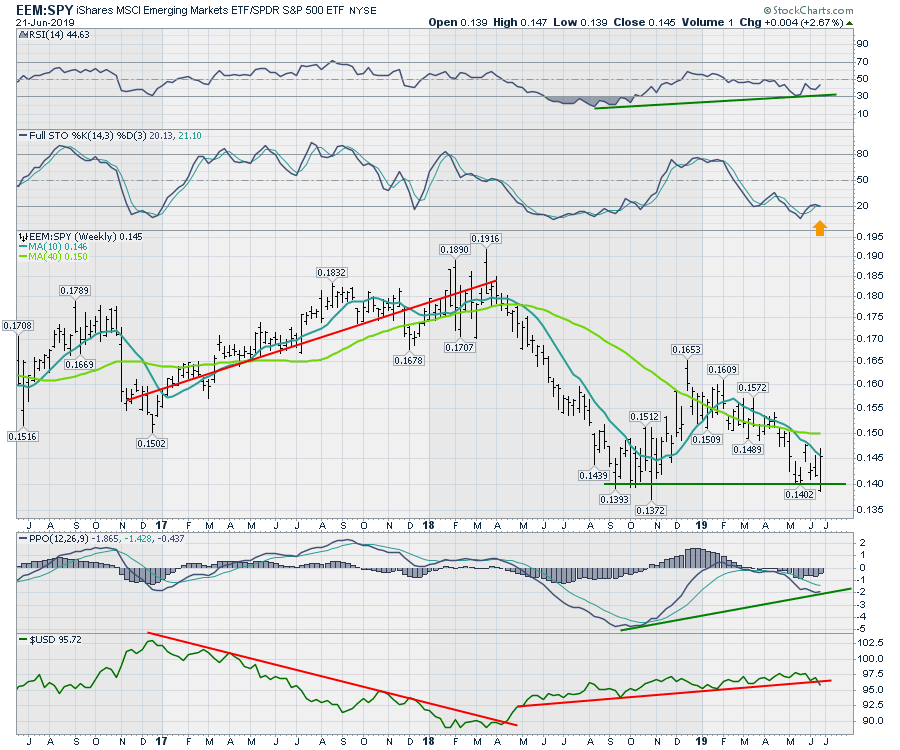 For all the money managers suggesting to diversify, this chart can be helpful for deciding when to be in or out of emerging markets.
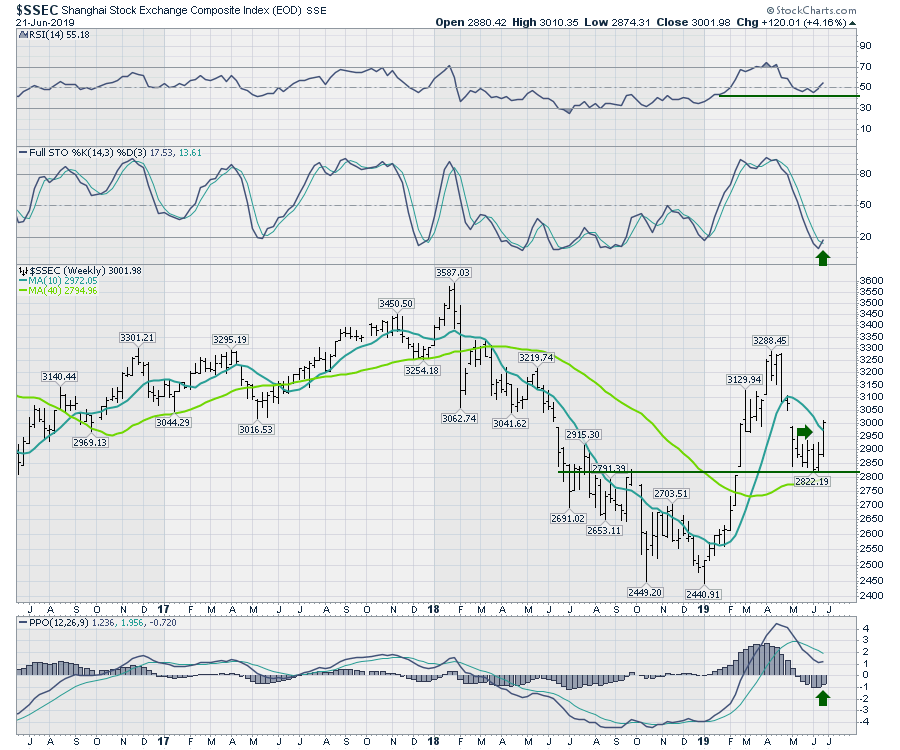
One specific foreign market is the Shanghai market, which is behaving very bullishly along with the Hong Kong market. The charts suggest optimism to me. The RSI held above 40, which can be a bull trait. The full stochastic is turning up, which is usually the first indicator signal on a weekly chart. The price action held above the 40-week moving average and the PPO appears to be turning up above zero. All of these lead to a bullish stance.
Check this week's Canadian Technician video for a lot more currency information.
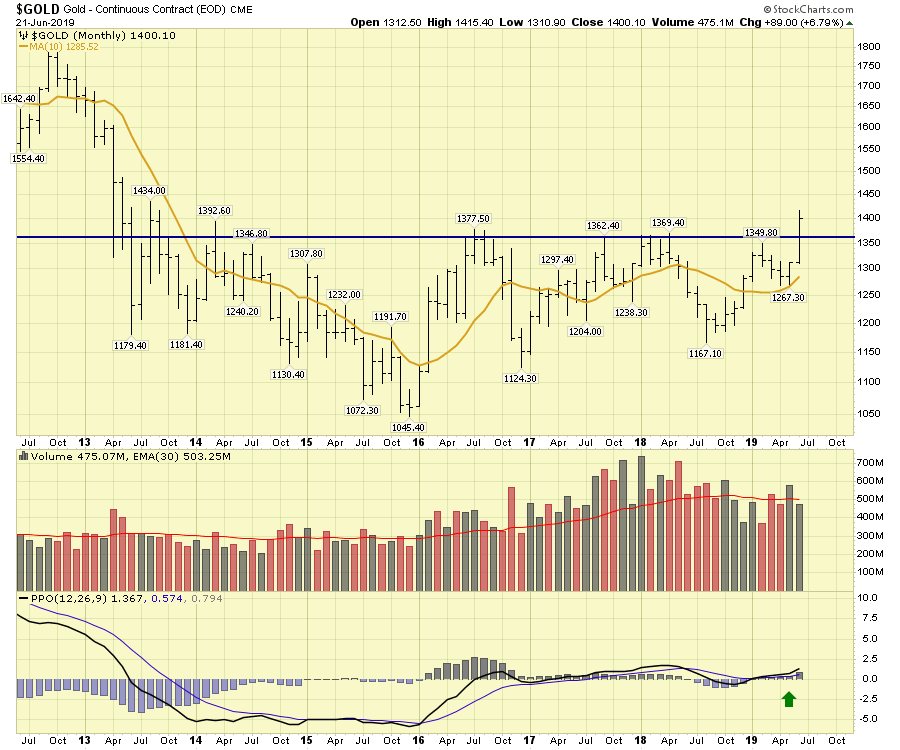
The next benefit to a dropping US Dollar is commodities. Obviously, Gold is on a run. The setup is there for Gold to continue with a dropping US Dollar. It would appear this move is just starting, with all the indicators turning green. A consolidation in an uptrend is pretty normal and we are already up $130 off the May lows. If a pullback does occur, I would continue this trade as a bull trend. The setup on the PPO is the nicest setup in 5 years.
 The Gold Miners look well set up too, as seen below.
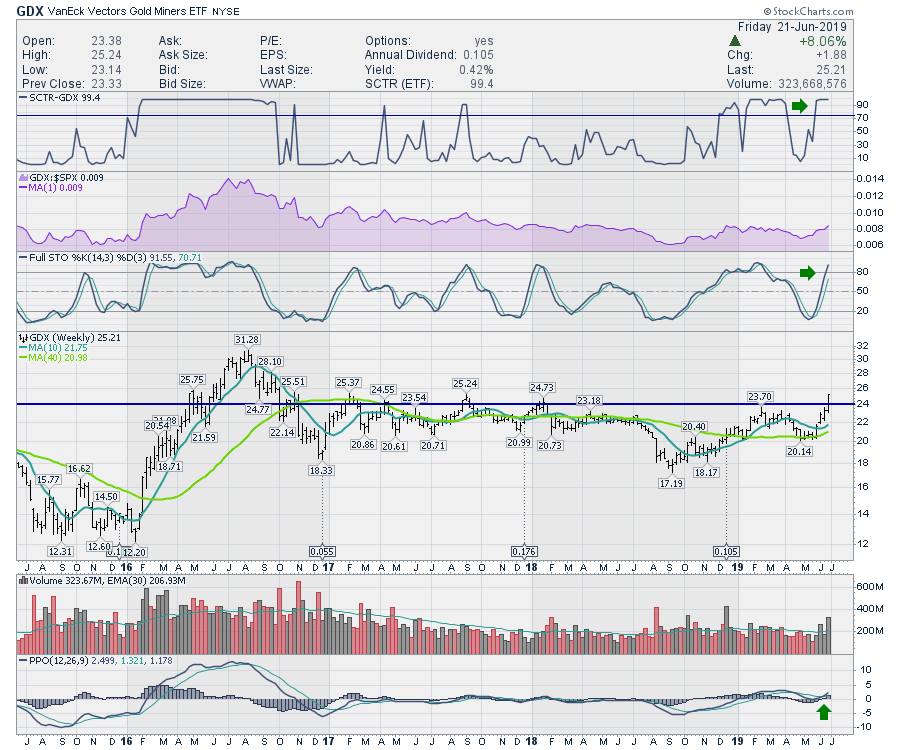 I need to highlight that commodity-related trades are swing trades. They are not like a long-term Microsoft trade with leadership guiding the company higher. Commodity stocks move quickly both ways. A Gold-related trade in June is up 35% since May 31. There are lots that are moving even faster. But they also have to be exited as they move quickly in both directions. The Gold Miners ETF moved 150% in 6 months in 2016, whereas Gold moved 30%. When the trade was done, GDX dropped meaningfully for the next 6 months, wiping out a lot of the gains. Understanding the asset class is important to trading it.
Check the video this week for a lot more commodity information, including crude oil, copper, steel, lumber, rare earths and lithium.
I have been moving into the bullish camp, with the breadth starting to advance meaningfully in ways we haven't seen since the market top in January 2018. This is the Net New Highs for the NYSE.
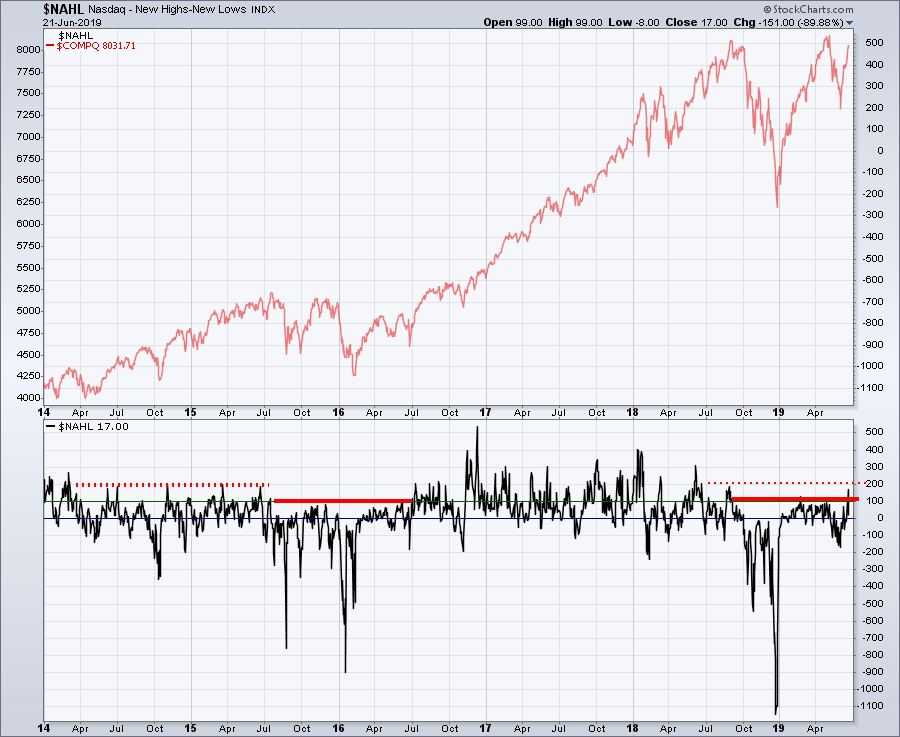
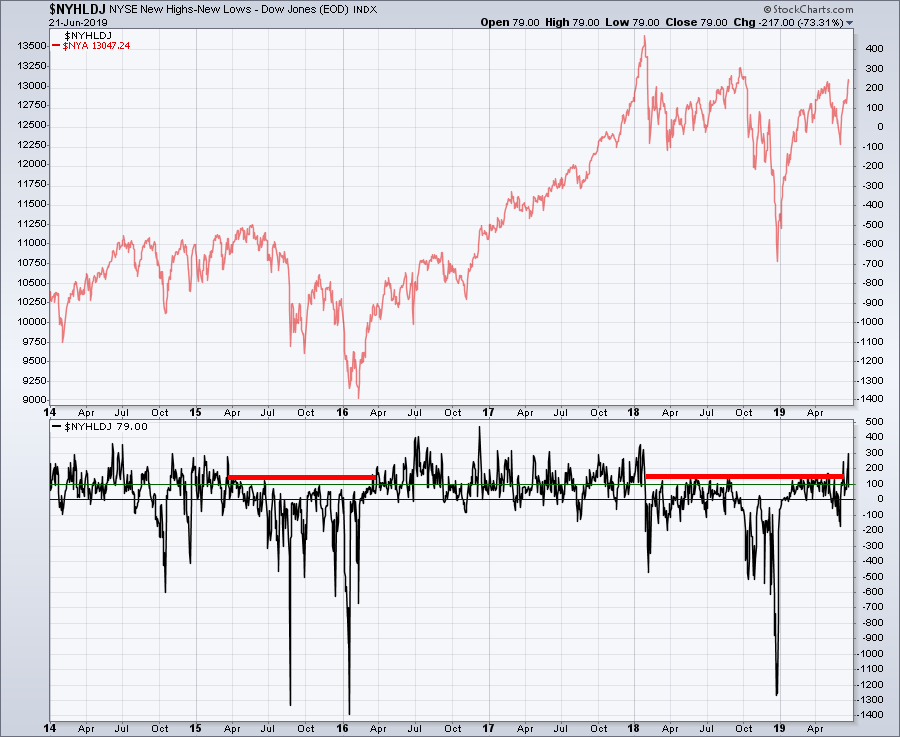 The Nasdaq Composite Net New Highs joined the bullish chart camp this week with a similar surge. We have to start somewhere - the surge this week suggests that might be happening. If we can get rolling like 2016, that is bullish.
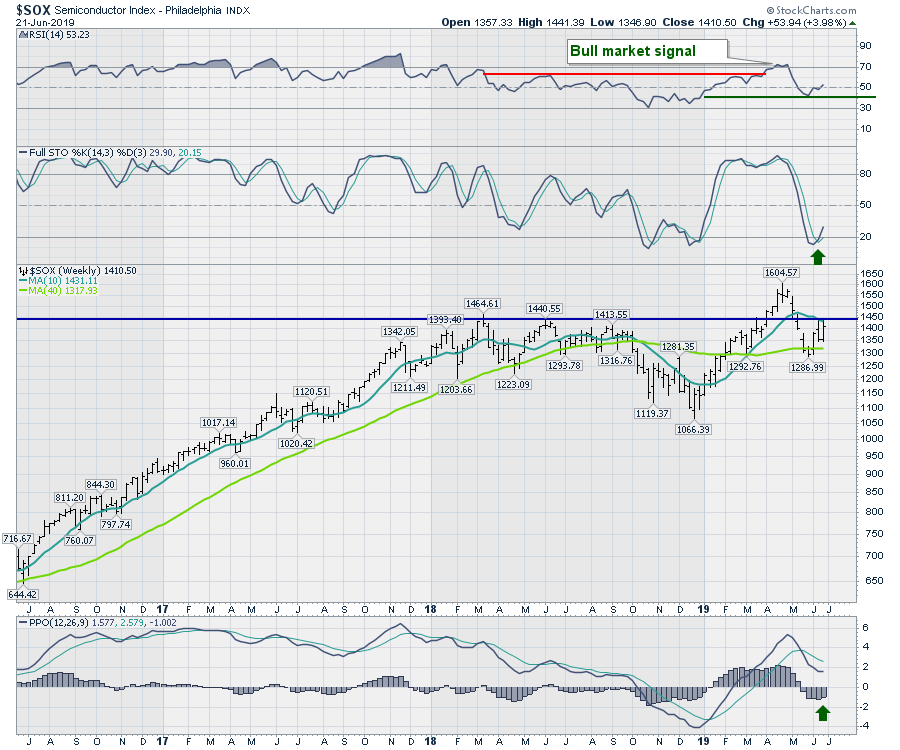
 So far, the semis are lacking a little. A bull market wasn't built in one week, but the charts are improving. The semiconductors traded in the same range as last week, but closed at the top of the range. The RSI is on a bull market signal, so this bounce happened where we would expect it to, at the 40 level. The PPO turning up above zero is also bullish; while it hasn't crossed yet, it is trying. Lastly, the price resistance line at 1441 is pretty important and we are there now.
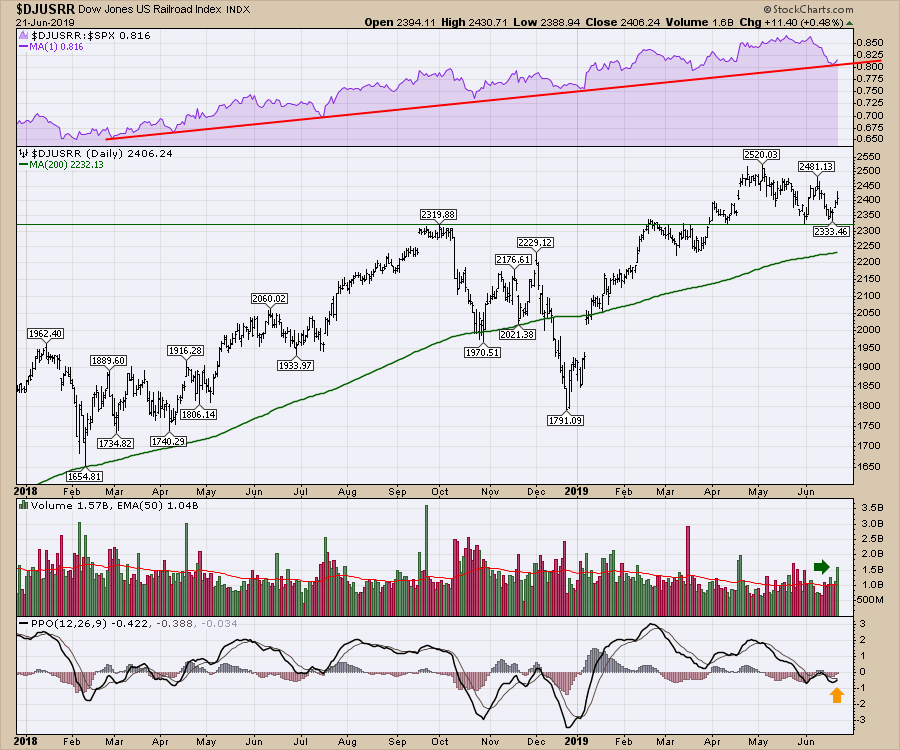
 The transports have been underperforming, but are trying to get going. The rails were weak last week, which is a little uncomfortable for me. The purple area chart shows that the rails have been dropping in relative strength since the beginning of the month. The trend has been up for a year, with the rails outperforming. If the bounce that is setting up here follows through, that would be helpful confirmation of the bullish trend resuming. The price bouncing off horizontal support is also a positive setup.
Coming off the back of the Fed meeting and quadruple options expiration, I am something of a nervous investor. I will say that the volume on the Options Expiration Friday was not higher than the previous three, which marked some meaningful market turns. All the indicators I follow are starting to go bullish; if the markets have another up week, that will confirm the trend. I guess that's what happens when central banks promise more easing!
Check out the video this week for a lot more information. The weight of the evidence is leaning bullish.
Greg Schnell, CMT, MFTA
Senior Technical Analyst, StockCharts.com
Author, Stock Charts For Dummies
Want to stay on top of the market's latest intermarket signals?
– Follow @SchnellInvestor on Twitter
– Connect with Greg on LinkedIn
– Subscribe to The Canadian Technician

