In an up-sloping week, the one-way trade continues. More groups continued to improve and momentum continued to move higher. Of the weaker industries, the majority still have improving momentum. 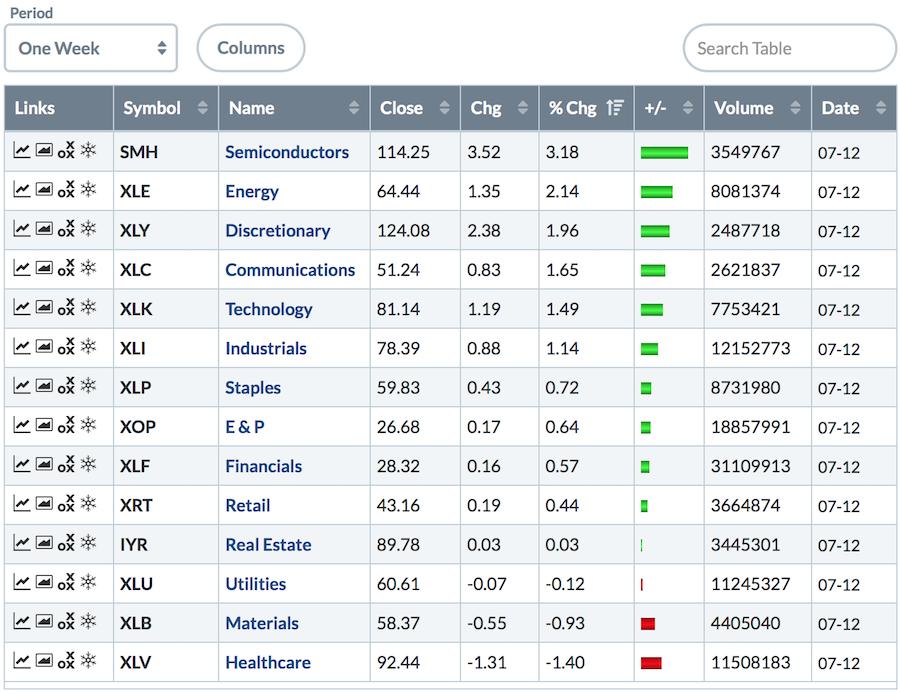 Growth Industries Outpaced Defensives
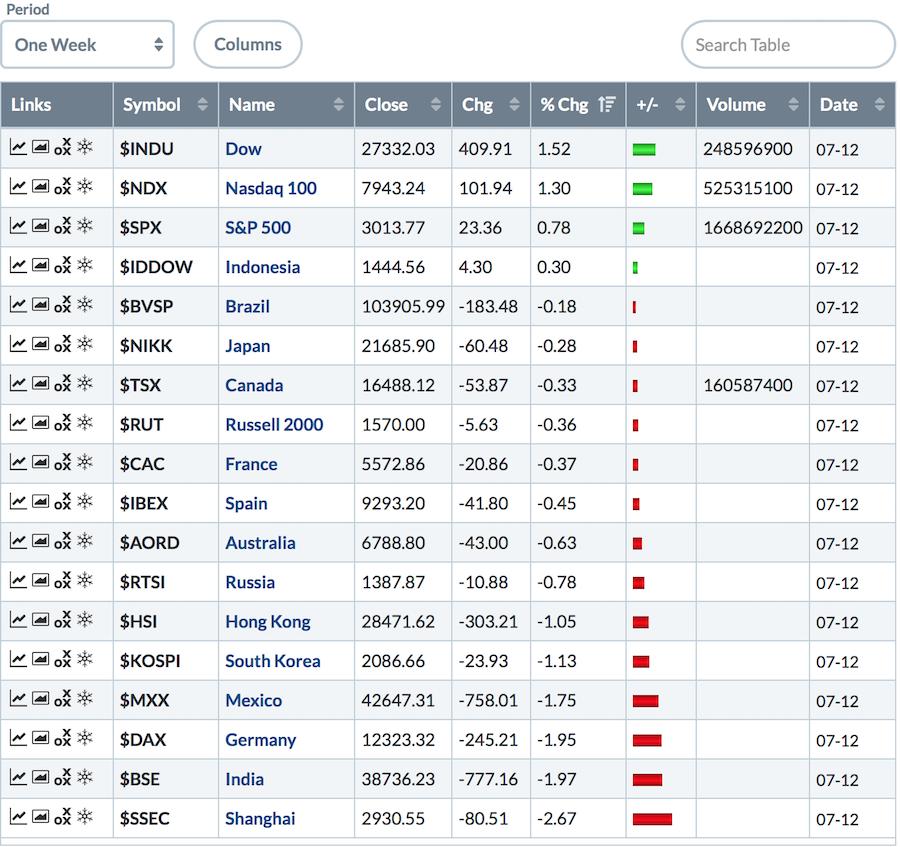
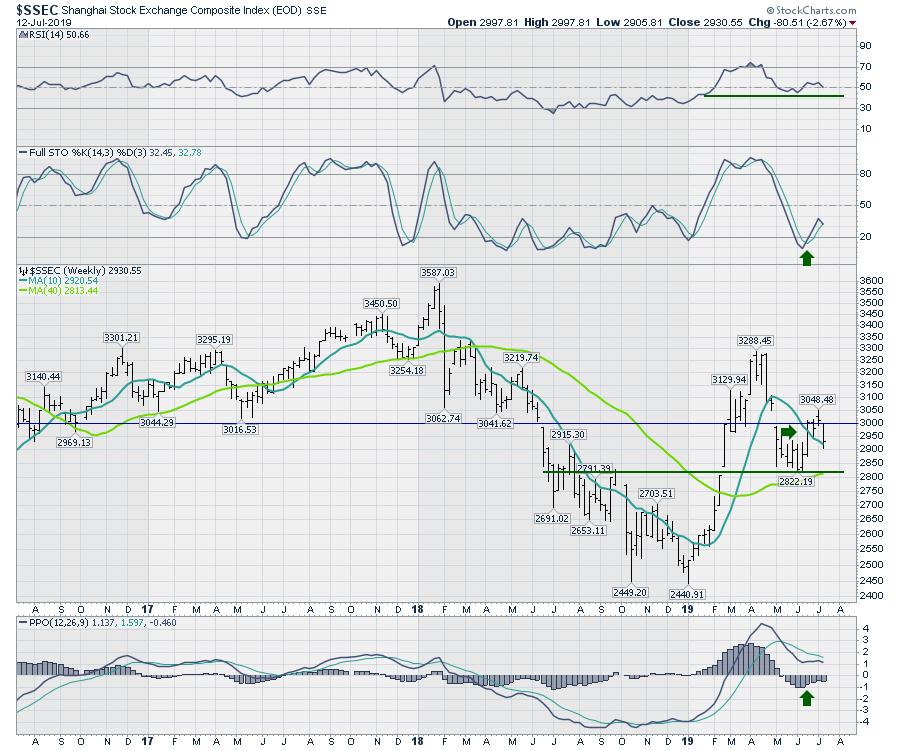
However, the good news was not global. Markets around the world dropped this week. The two most populated countries had the biggest drops, with the Shanghai market falling quickly this week from an important resistance level.
The Shanghai chart is quite weak. First of all, the weekly full stochastic could give a reversal below 50.That is typically seen on bearish charts and is definitely a marker for a chart to watch this week. The 3000 level was support and is now resistance. The PPO is pointed down, which suggests further declines. The rally of the last few weeks was not enough to change the weekly momentum trend shown on the PPO. With the pendulum swinging back to declines on the Chinese market, this is very concerning.
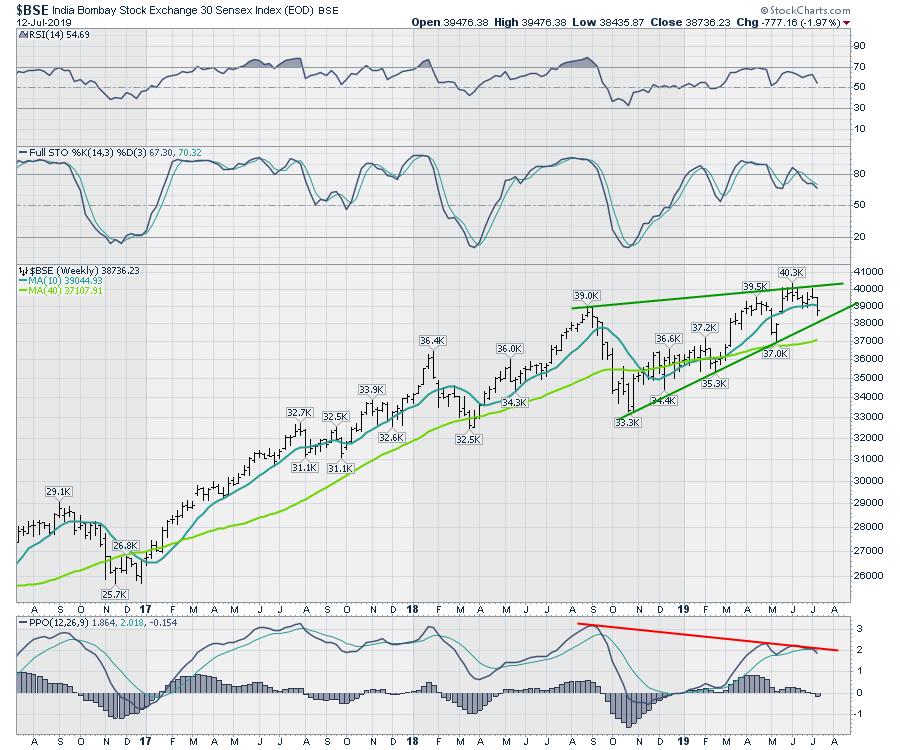
India recently held elections, and the $BSE stock exchange has been very robust for a long time. One thing is showing up this week, though - we have a PPO sell signal on the chart, but we also have negative divergence on this high compared to the high back in September 2108. Negative divergence is when the momentum indicator is making a lower high compared to the price, which is making a higher high. It looks like the uptrend line will be tested this week. Thus, we have another chart that looks like the pendulum wants to go the other way.
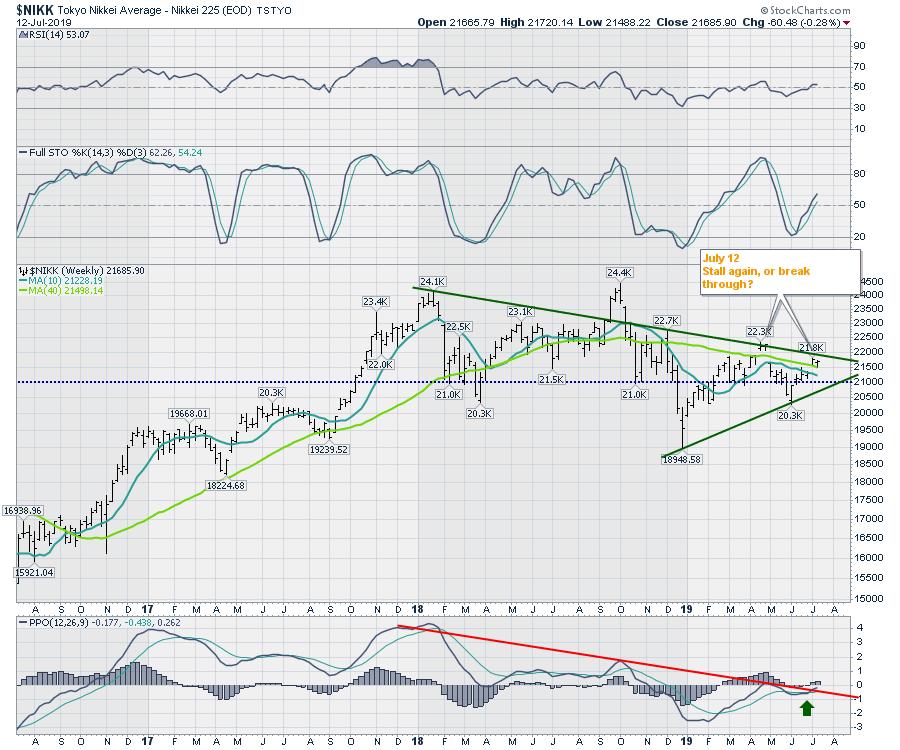
As regular readers know, I am continuing to watch Japan, with all of the debt and central bank issues they have. Can the chart make a higher high this month? One important level is 21000, a major long time level on the chart that would also break the uptrend. The PPO is right at zero, which is where it stalled on the last high. If Japan can break out here, that would swing the PPO into positive territory and the pendulum to bullish.
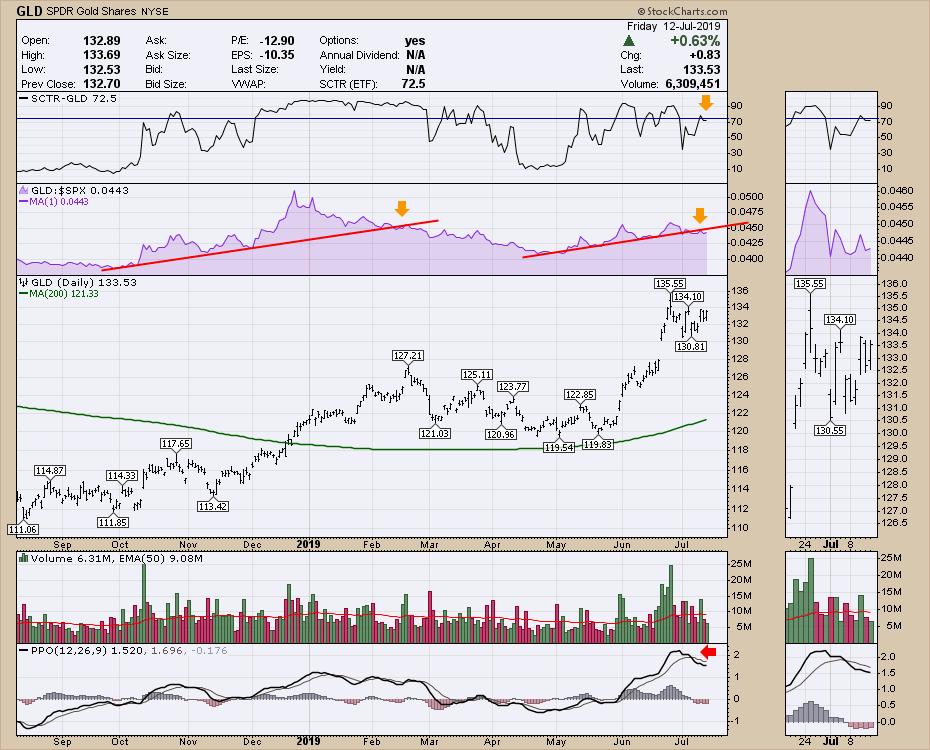
I covered Commodities on the Weekly Market Review. One of charts that needs close attention this week is Gold. On the daily chart, Gold is starting to underperform the $SPX. The weekly chart looks okay, but this would be a big surprise for Gold bulls. Notice the relative strength line on the daily.
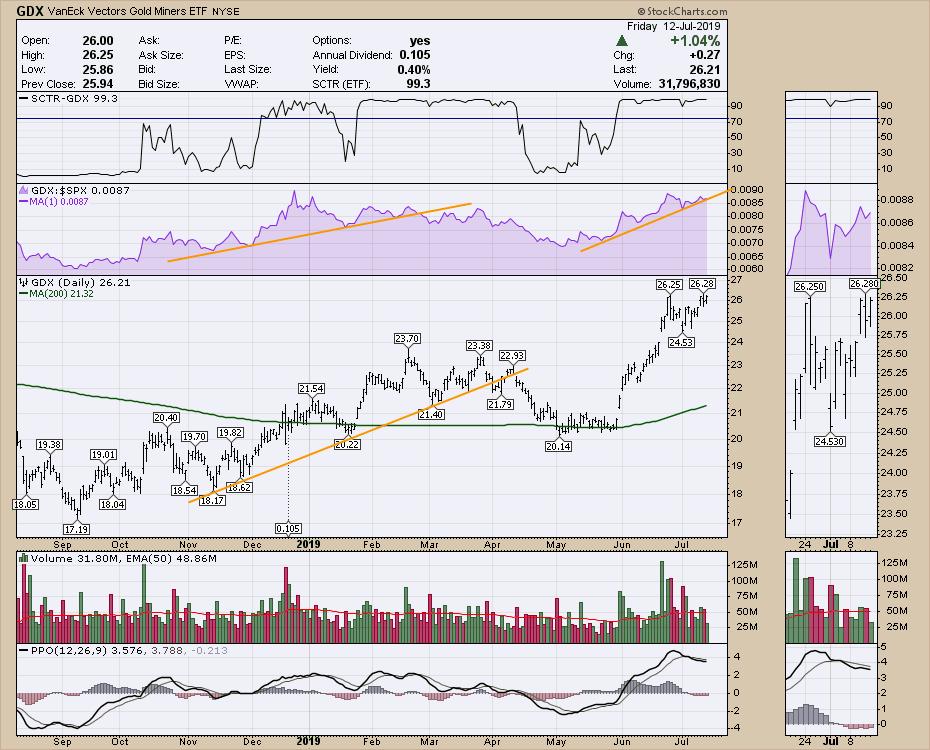
I will say that the Gold Miners ETF is still bullish, so that suggests Gold will continue to rally.
Here is the link to this week's market review. Starting soon, my weekly market review video will be a separate subscription.
 US Market Review
With new highs, I remain bullish. The dichotomy of weak earnings and higher markets is always hard for fundamental investors. It continues to feel like a cliff edge, but the breadth data has been supportive. On the video, I pointed to a couple of breadth indicators that make me nervous, but bullish. It wouldn't take much to change my view, but the arrows point higher so far.
In case you missed my SCTR article in ChartWatchers this week, here is the link.
Good trading,
Greg Schnell, CMT, MFTA
Senior Technical Analyst, StockCharts.com
Author, Stock Charts For Dummies
Want to stay on top of the market's latest intermarket signals?
– Follow @SchnellInvestor on Twitter
– Connect with Greg on LinkedIn
– Subscribe to The Canadian Technician
– Email at info@gregschnell.com
