ChartWatchers March 20, 2004 at 11:05 PM

Breadth stats reflect continued preference to be overweight small and mid-caps, while underweight techs and large-caps. As the AD Volume Lines show, the S&P Midcap Index and S&P SmallCap Index remain the strongest... Read More
ChartWatchers March 20, 2004 at 11:04 PM
The trend and condition of the market should dictate the kind of actions we will take, so these are the first things we should evaluate during the process of making investment/trading decisions... Read More
ChartWatchers March 20, 2004 at 11:03 PM
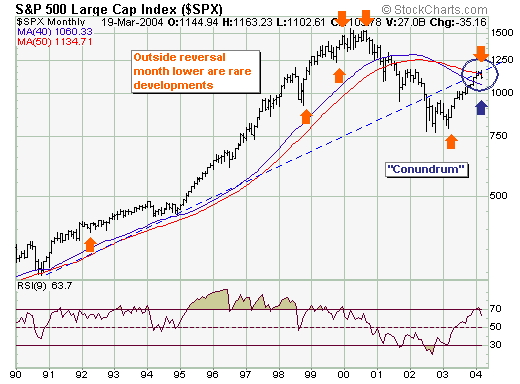
The past two-month trading period is one at the present time considered a "correction"; however, there are nascent signs it may be something quite a bit larger than just your "garden variety" correction... Read More
ChartWatchers March 20, 2004 at 11:02 PM

SHARPCHARTS2 BETA 3 - The improvements just keep coming! This week, we've added the Money Flow Index (see Chip's article above), Equivolume charting, support for annotations, the ability to email charts to others, the ability tostore charts in your browser's "bookmark" area, and ... Read More
ChartWatchers March 20, 2004 at 11:01 PM
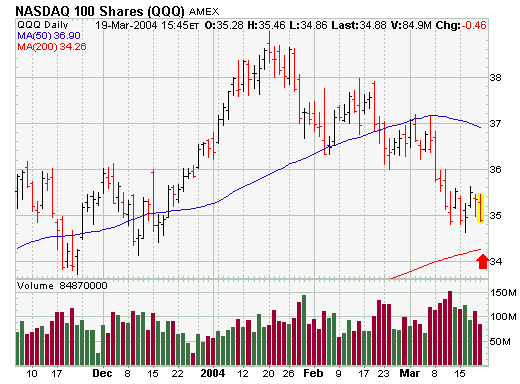
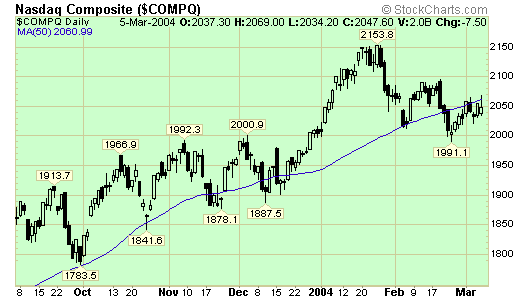
NASDAQ 100 LEADS MARKET LOWER... The Nasdaq 100 QQQs were the worst percentage losers on Friday and reflected continuing weakness in the largest technology stocks. The daily chart shows the QQQ ending the week on a down note. The only saving grace was the relatively light volume... Read More
ChartWatchers March 20, 2004 at 11:00 PM
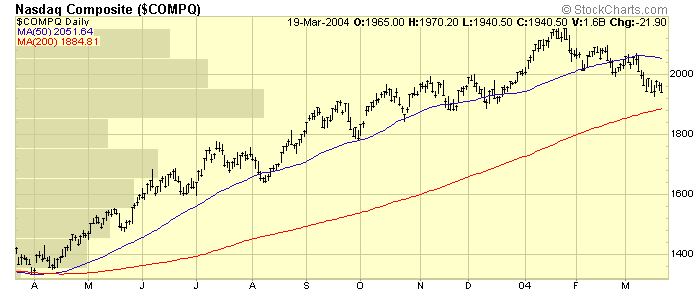
The current market pull-back is getting serious... Read More
ChartWatchers March 06, 2004 at 11:05 PM
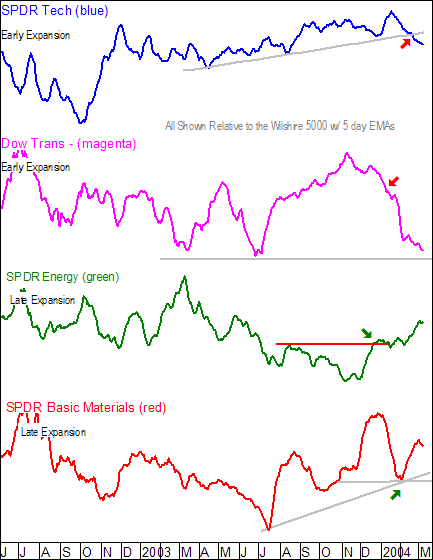
Relative strength or price relative charts provide an idea of which sectors will lead and lag over the next few weeks and months. These are formed by dividing the Sector Index by the Wilshire 5000 or another broad market index... Read More
ChartWatchers March 06, 2004 at 11:04 PM

When the monthly PMO (Price Momentum Oscillator) reaches a range extreme and changes direction, it is a pretty good indication that the long-term trend is changing... Read More
ChartWatchers March 06, 2004 at 11:03 PM
The stock market environment over the past six weeks has been fraught with a good deal of rotation out of specific indices such as the Dow and Nasdaq and into the S&P 400 midcaps and S&P 600 small caps... Read More
ChartWatchers March 06, 2004 at 11:02 PM

SHARPCHARTS BETA 2 NOW AVAILABLE! - We're continuing the roll-out of our new charting engine - SharpCharts 2 - with the release of the second "Beta" version this week... Read More
ChartWatchers March 06, 2004 at 11:01 PM

WEAK JOBS REPORT A MIXED BLESSING ... Today's weak job report was a shocker. It's weakness, however, is a mixed blessing. It's a potential negative for the economy since it erodes consumer confidence... Read More
ChartWatchers March 06, 2004 at 11:00 PM
Last week saw all of the major averages post modest gains with the Russell 2000 (+2.3%) leading the way... Read More