ChartWatchers April 17, 2004 at 10:05 PM
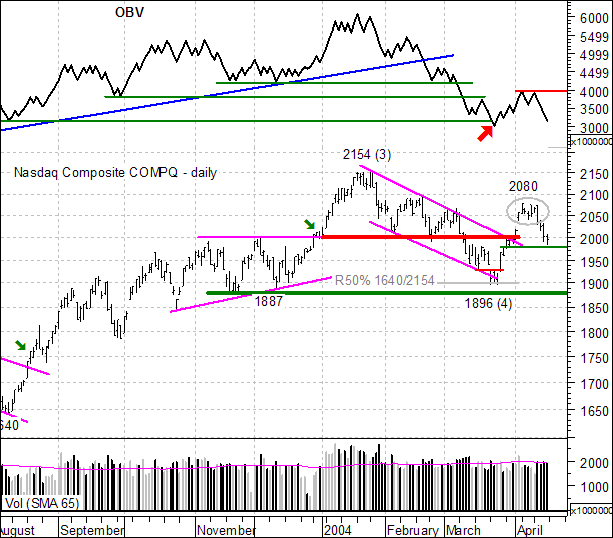
On Monday we were focused on the pennant consolidation with support at 2038 and resistance at 2080 (gray oval). While these are typically bullish continuation patterns and an upside breakout was expected, it was prudent to wait for confirmation... Read More
ChartWatchers April 17, 2004 at 10:04 PM
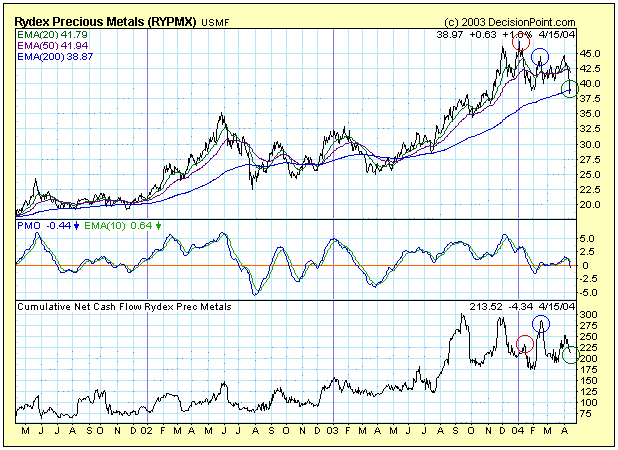
DecisionPoint.com tracks net cumulative cash flow of Rydex mutual funds as a way of estimating sentiment in various sectors. The theory is that money 'ought' to follow prices, more or less... Read More
ChartWatchers April 17, 2004 at 10:03 PM
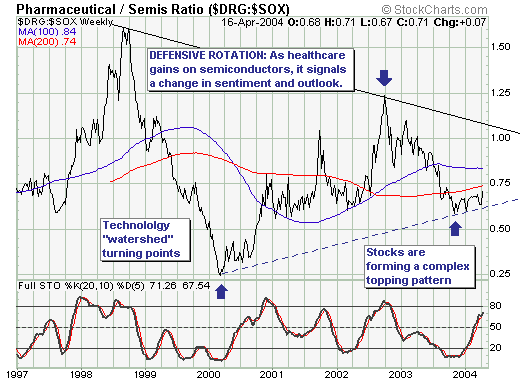
This past week brought in "clear view" the under the surface rotation that has been occurring from the technology sector into the healthcare/pharmaceutical sector - and thus we think it important to look at the Pharmaceutical/Semiconductor RATIO... Read More
ChartWatchers April 17, 2004 at 10:02 PM
MURPHYMORRIS.COM CLOSING SOON - Sometime in the next couple of days, we expect to complete the transition of John Murphy's tools and commentary from the "Members" tab on the MurphyMorris.com website to the "John Murphy" tab on the StockCharts.com website... Read More
ChartWatchers April 17, 2004 at 10:01 PM
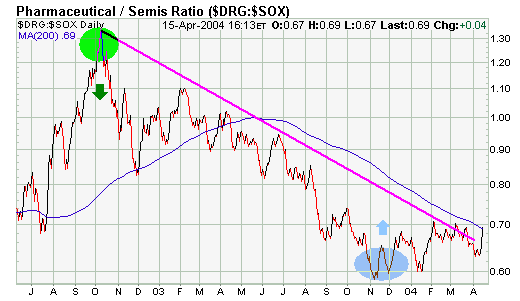
DRG/SOX RATIO IS RISING... Earlier in the year I did an analysis of the DRG/SOX ratio as a way to try to measure the mood of the market. The ratio divides the Drug Index (DRG) by the Semiconductor (SOX) Index... Read More
ChartWatchers April 17, 2004 at 10:00 PM
All-in-all, last week was a down week for the major market averages. While the Dow managed to eek out a tiny gain, the other indices fell with the Nasdaq (-2.79%) leading the way. So far this year, the energy-heavy Amex Composite (+5.64%) and the Russell 2000 (+4... Read More
ChartWatchers April 03, 2004 at 11:05 PM

The Philadelphia Gold Index, $XAU, is usually a better predictor of gold than gold is of $XAU. The top chart shows $XAU relative to gold or the "price relative"... Read More
ChartWatchers April 03, 2004 at 11:04 PM
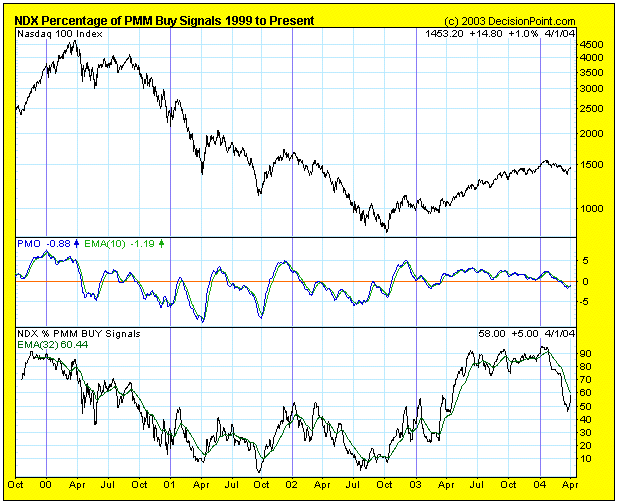
Does the world really need another indicator? Well, this is one we have been collecting data on for years, but we just recently started charting it because we discovered it presents a good picture of internal market strength or weakness... Read More
ChartWatchers April 03, 2004 at 11:03 PM
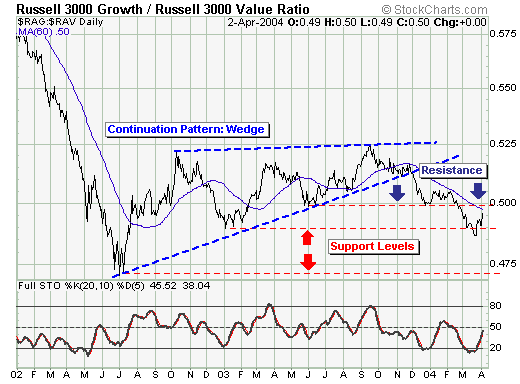
In terms of gauging the current substantial rally, we should look at the relative performance of the "growth" and "value" components thereof. In effect, if we are bullish, then we want to be long that which is outperforming. This is fairly simple... Read More
ChartWatchers April 03, 2004 at 11:02 PM
CALENDAR CONTROLLERS ADDED TO SC3 BETA - We aren't rolling out lots of new features this week like we have in weeks past, however we did manage to add two very neat icons to the "User-Defined" Duration section of the SharpCharts2 Beta page... Read More
ChartWatchers April 03, 2004 at 11:01 PM

10-YEAR YIELDS SOAR OVER 4%... While today's surprisingly strong jobs report was good for stocks, it was very bad for bonds. Bond prices fell more than two full points. The 10-year T-note, which rises when prices fall, surged all the way to 4.14%... Read More
ChartWatchers April 03, 2004 at 11:00 PM
The markets are rebounding strongly right now and trying to put the declines from February and March behind them. Most of the major averages moved back above their 50-day Moving Average on Friday (not the Dow though...)... Read More