ChartWatchers May 21, 2005 at 10:05 PM
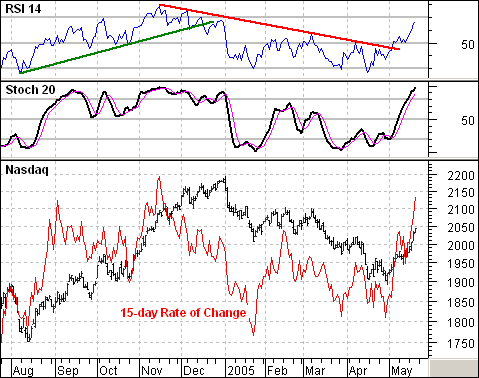
The current rally is the strongest of the year and is unlikely to disappear over night. This strength is confirmed by price movement as well as two momentum indicators. First, the 15-day Rate-of-Change surged to levels not seen since early September and mid November... Read More
ChartWatchers May 21, 2005 at 10:04 PM
One of Decision Point's proprietary indicators is the Participation Index (PI). It measures extreme (climactic) activity within a short-term price envelope... Read More
ChartWatchers May 21, 2005 at 10:03 PM
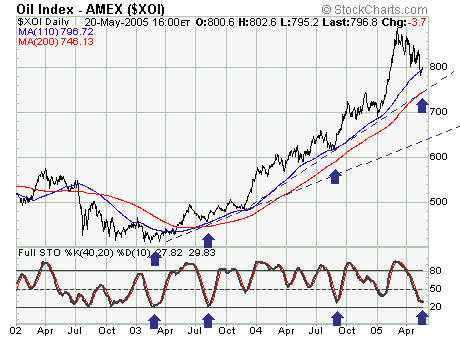
Quite simply, the recent decline in the AMEX Oil Index (XOI) appears corrective in nature; and thus one would want to be long these shares at this time as the risk-reward parameters are now favorable... Read More
ChartWatchers May 21, 2005 at 10:01 PM
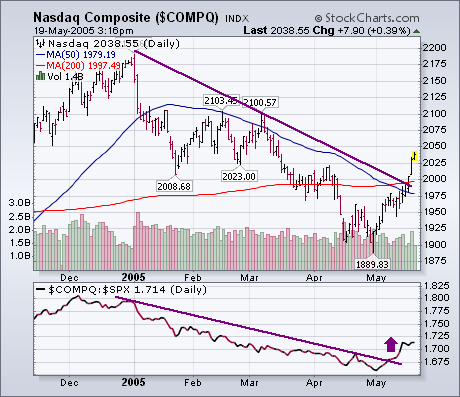
In my view, the most significant improvement has taken place in the technology-dominated Nasdaq market. The Nasdaq Composite Index broke through its 200-day average on Tuesday and has broken its 2005 down trendline... Read More
ChartWatchers May 21, 2005 at 10:00 PM
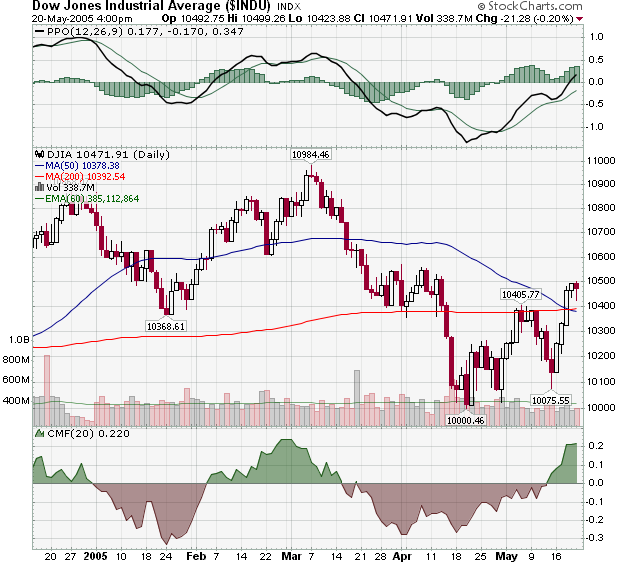
It took a couple of big days to get the Dow back above the 10,400 level but last week's reaction rally has managed to do the trick and allowed the Dow to finish at 10,471... Read More
ChartWatchers May 07, 2005 at 10:05 PM
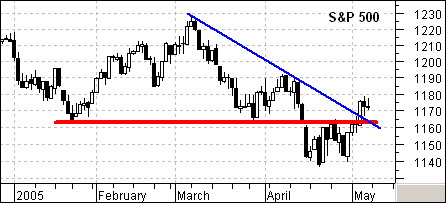
The S&P 500 can do it, but the Nasdaq and the Small-caps can't do it. Or at least not just yet. Led by Finance, the S&P 500 broke above its late April high and resistance at 1165. However, the Nasdaq and S&P SmallCap Index stalled at corresponding resistance levels... Read More
ChartWatchers May 07, 2005 at 10:04 PM
The CBOE Volatility Index (VIX) is a measure of the implied volatility of SPX index options. (According to the CBOE web site, "volatility is a measure of the fluctuation in the market price of the underlying security... Read More
ChartWatchers May 07, 2005 at 10:03 PM
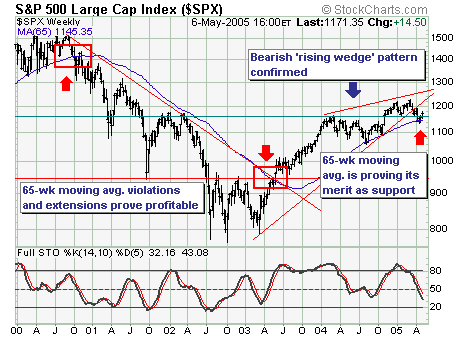
From a structural and fundamental point-of-view, things are bearish right now; however, the technical and sentiment action surrounding recent price gains is quite constructive; thus a larger rally appears underway... Read More
ChartWatchers May 07, 2005 at 10:01 PM
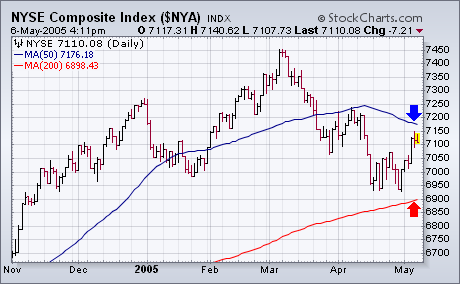
Every time I write about a certain stock market index, I'm asked why I don't write about some of the others. I generally try to spread my coverage around to all the major stock indexes, but can't cover them all at once... Read More
ChartWatchers May 07, 2005 at 10:00 PM
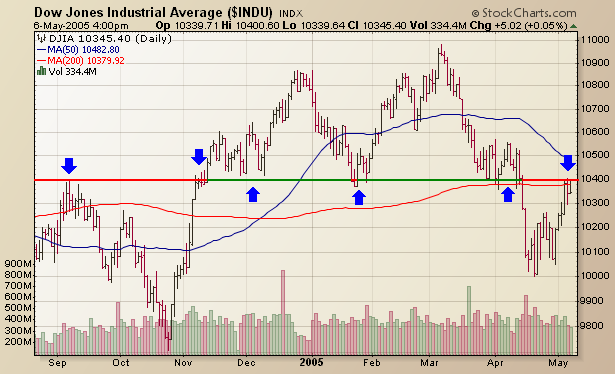
After its big drop in mid-April, the Dow has rallied back to a classic resistance level now: 10400... Read More