ChartWatchers March 21, 2009 at 06:43 PM
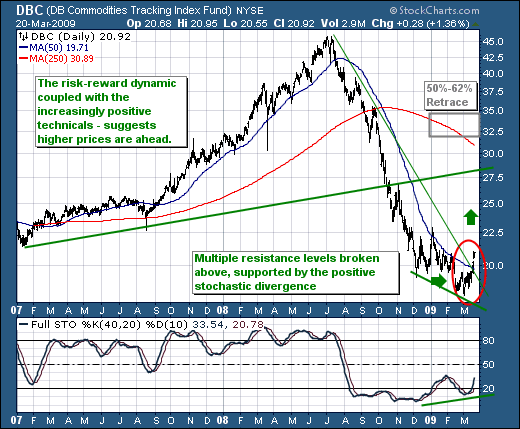
The Fed's midweek surprise announcement that it was buying Treasury bonds had a fairly predictable ripple effect through the various financial markets. Naturally, Treasury bond prices jumped and yields collapsed... Read More
ChartWatchers March 21, 2009 at 06:27 PM
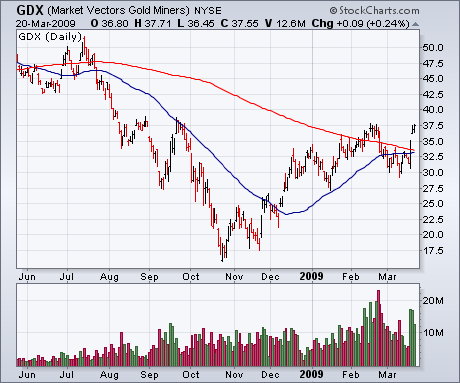
The FOMC has now become very serious to put an end to the financial crisis. To put it simply, Wednesday's FOMC announcement that they plan to roll the printing presses in order to buy $200 billion in longer-dated treasury paper is certainly a "positive... Read More
ChartWatchers March 21, 2009 at 06:20 PM
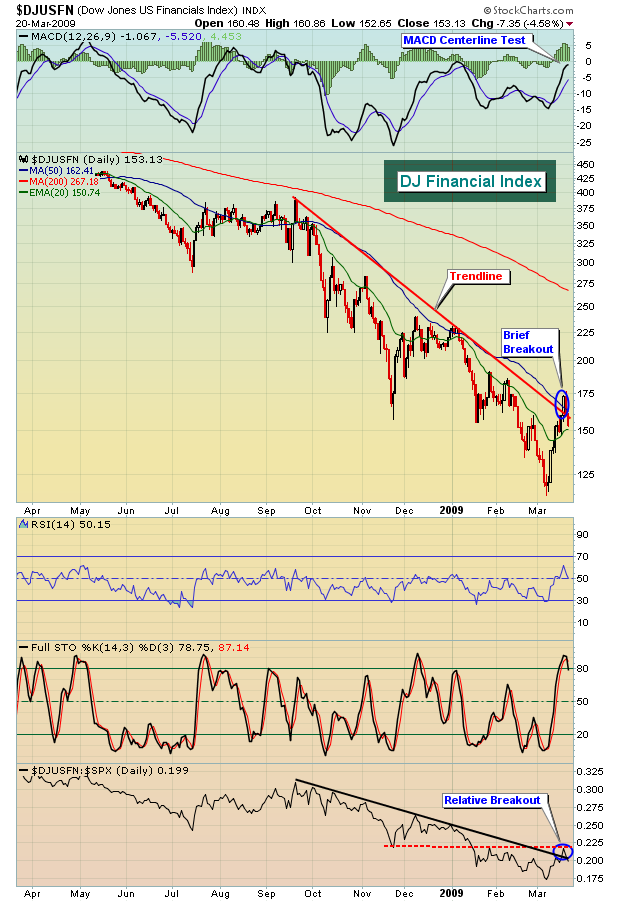
The market performance the last two weeks was very impressive. Was it simply a sequel to the bounces we saw in October and November? That is certainly a possibility, but we saw a few sparks in this rally. For instance, the volume that exploded in financials must be respected... Read More
ChartWatchers March 21, 2009 at 06:13 PM
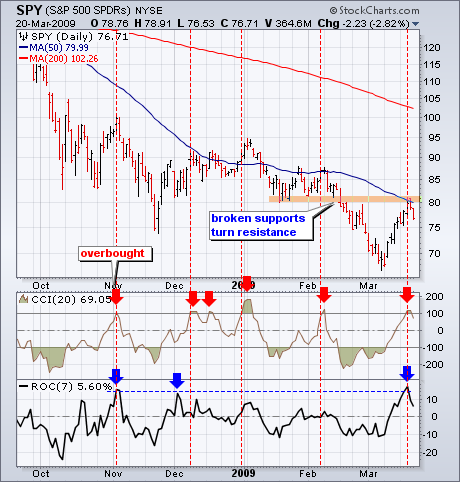
After a sharp advance the last two weeks, SPY hit a classic resistance zone and pulled back over the last two days. Three items confirm resistance in the low 80s. First, broken support around 80-81 turns into resistance. Second, the falling 50-day moving average marks resistance... Read More
ChartWatchers March 21, 2009 at 03:15 PM
Today we're unveiling several design changes to the "John Murphy" area of our website. These changes include: A new, cleaner design that echos the look of our free commentary areas - i.e. out blogs (i.e... Read More
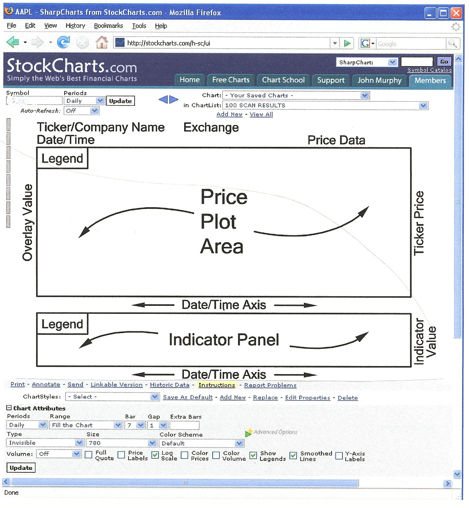
ChartWatchers March 21, 2009 at 03:06 PM
This is the fourth part of a series of articles about Technical Analysis from a new course we're developing. If you are new to charting, these articles will give you the "big picture" behind the charts on our site... Read More
ChartWatchers March 20, 2009 at 07:29 PM
Quite a few years ago I used to write a daily newsletter, but I decided to give it up because it got tiresome trying to invent new ways to say the same thing over and over... Read More
ChartWatchers March 08, 2009 at 05:14 AM
NEW "WHAT'S NEW" AREA - We've reworked the "What's New" area on the "Members" page so that it now shows you all of the latest posts from our various blogs... Read More
ChartWatchers March 08, 2009 at 12:55 AM
This year has seen the S&P decline by -24.3%; with the building crescendo of "fear" likely to provide for a bottom that can be traded sooner rather than later... Read More
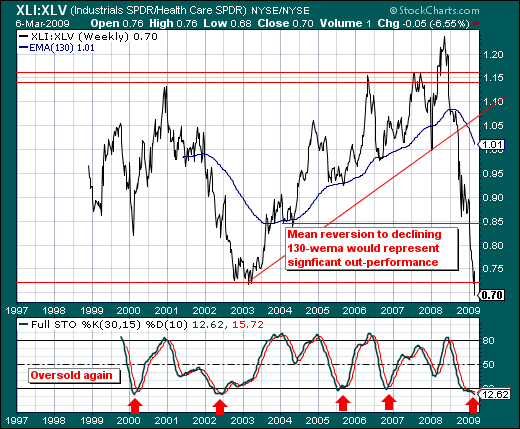
ChartWatchers March 08, 2009 at 12:44 AM
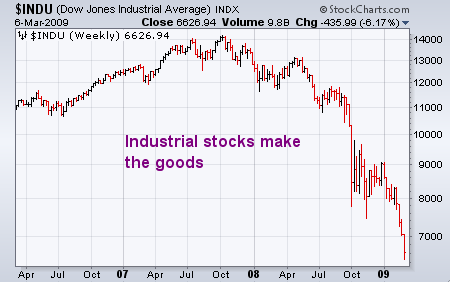
At the start of the 20th century, Charles Dow invented the Dow Theory. It was a simple idea. He created two stock indexes -- one for industrial stocks and one for the transports (which were exclusively rails)... Read More
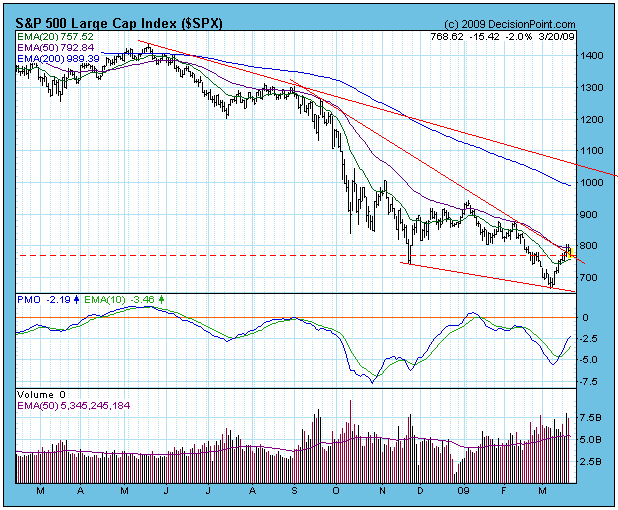
ChartWatchers March 08, 2009 at 12:29 AM
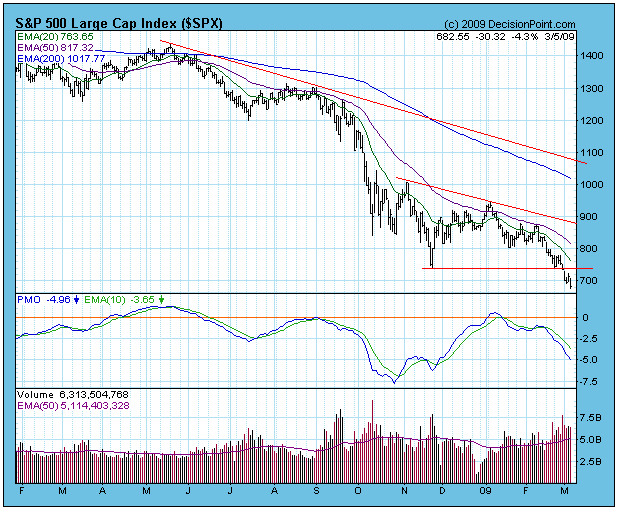
At the end of last week the S&P 500 had declined to and had settled on the support created by the November lows. It was poised to either rally and lock in a double bottom, or break down... Read More
ChartWatchers March 07, 2009 at 11:53 PM
Significant market bottoms generally share many key characteristics. I like to see a spike in volume to get that last wave of selling in place... Read More
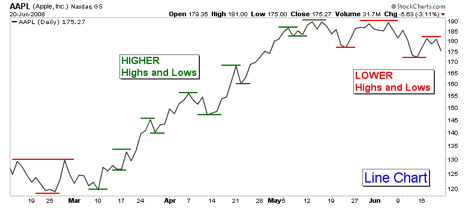
ChartWatchers March 06, 2009 at 07:17 PM
This is the third part of a series of articles about Technical Analysis from a new course we're developing. If you are new to charting, these articles will give you the "big picture" behind the charts on our site... Read More