ChartWatchers June 21, 2009 at 01:44 PM
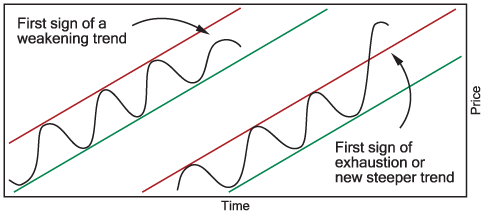
This is the ninth part of a series of articles about Technical Analysis from a new course we're developing. If you are new to charting, these articles will give you the "big picture" behind the charts on our site... Read More
ChartWatchers June 20, 2009 at 08:29 PM
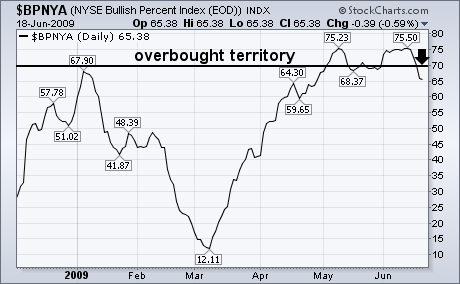
I recently showed the NYSE Bullish Percent Index (BPNYA) having reached overbought territory over 70. the BPNYA is the percent of NYSE stocks that are in point & figure uptrends. I suggested that a drop below the May trough at 68 could signal a short-term top... Read More
ChartWatchers June 20, 2009 at 08:25 PM
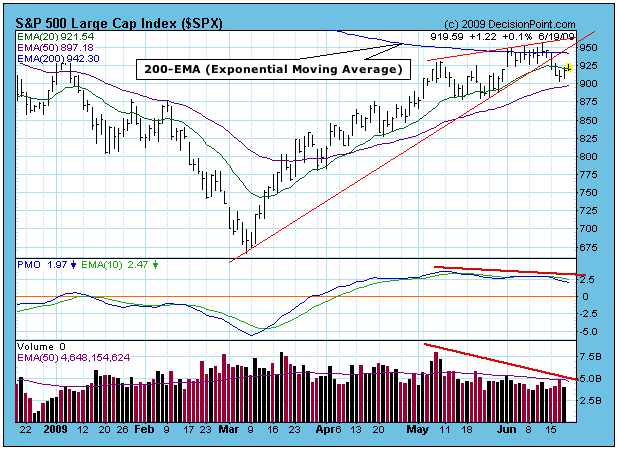
On Monday, in predictable fashion, prices broke down from the ascending wedge pattern we've been watching. Then, after a correction of 5%, prices began a snapback move up toward the recently violated support line (now overhead resistance)... Read More
ChartWatchers June 20, 2009 at 08:18 PM
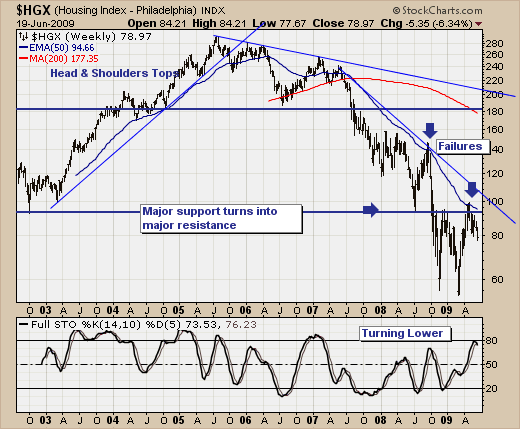
As the "green shootists" shout from the rooftops about the bottoming of the US and world economy; we think a technical and the Housing Index ($HGX) in particular offer keen insight as to whether one component of what led the US into the housing & credit market bubble..... Read More
ChartWatchers June 20, 2009 at 08:11 PM
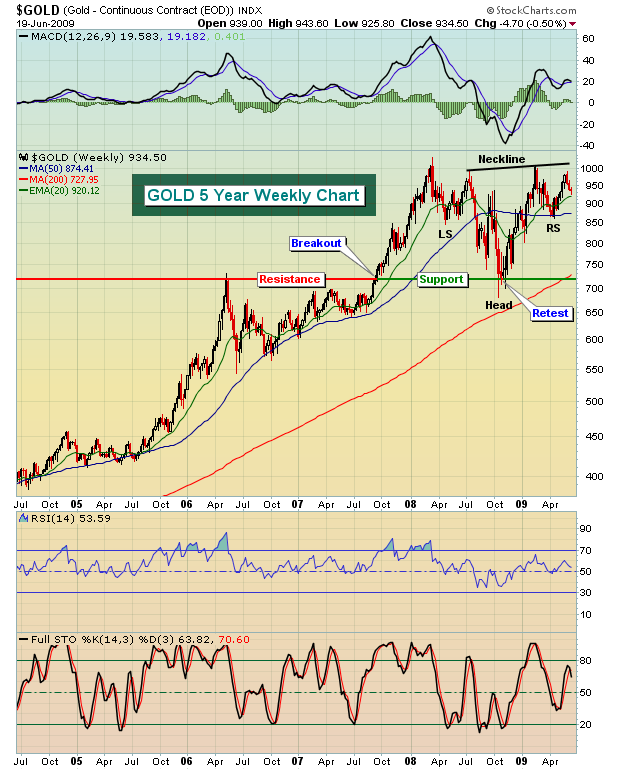
There are lots of questions in the market regarding possible inflation, deflation, and general market weakness. One way to hedge against all three is to play gold. Below is a long-term weekly chart that shows gold in a very bullish inverse head & shoulders continuation pattern... Read More
ChartWatchers June 19, 2009 at 03:04 PM
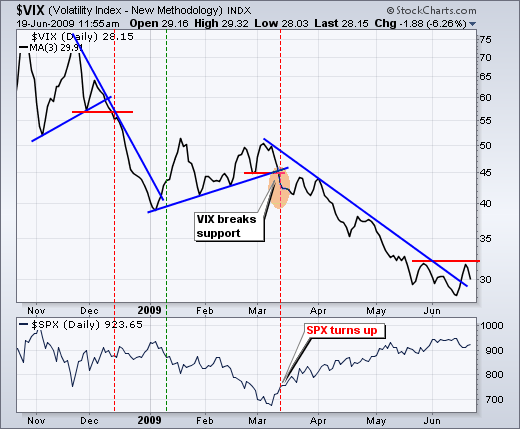
A downtrend in the S&P 500 Volatility Index ($VIX) underpins the current rally in the S&P 500. After all, decreasing fear gives way to confidence. The chart below shows the VIX as a 3-day SMA to smooth out daily fluctuations... Read More
ChartWatchers June 07, 2009 at 05:52 AM
We've just added a new "auto-complete" dropdown box feature to our home page. As you enter a ticker symbol or company name into the "Symbol" box, we now display suggestions from our symbol database for what we think you are looking for... Read More
ChartWatchers June 07, 2009 at 05:42 AM
This is the eighth part of a series of articles about Technical Analysis from a new course we're developing. If you are new to charting, these articles will give you the "big picture" behind the charts on our site... Read More
ChartWatchers June 06, 2009 at 10:22 PM
I've been bullish for several weeks now, but the tide is changing. We are running out of historical bullish periods until later in 2009... Read More
ChartWatchers June 06, 2009 at 10:14 PM
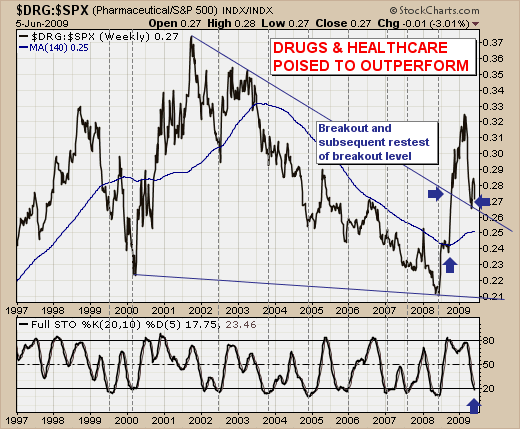
As the current rally perpetuates beyond what reasonable technicians would have thought at this point - the buying surge has now surpassed 57 trading sessions, it would appear traders are searching rather intently for those "laggard" groups or stocks to provide them with enhanced ... Read More
ChartWatchers June 06, 2009 at 10:06 PM
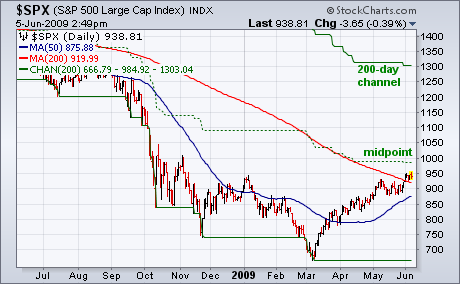
Virtually all major market indexes (including the Dow) have now exceeded their 200-day moving averages. That's a positive sign for the stock market, and adds more weight to the view that a major bottom has been seen... Read More
ChartWatchers June 06, 2009 at 10:02 PM
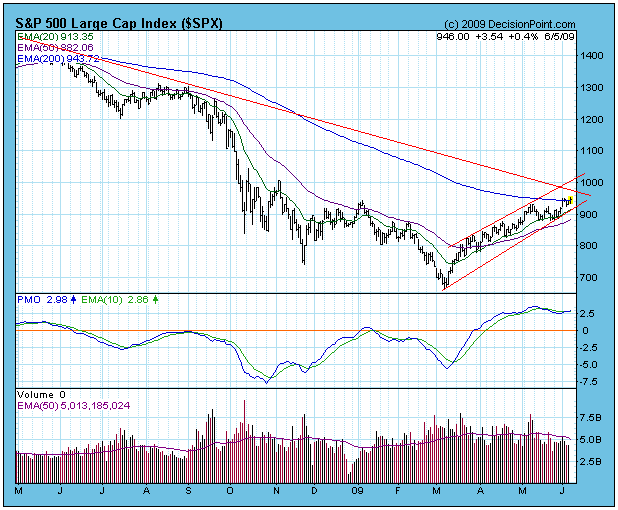
On the chart below we could attach a callout window to the rally that began in March and entitle it "Bull Market Rules Apply"... Read More
ChartWatchers June 05, 2009 at 07:27 PM
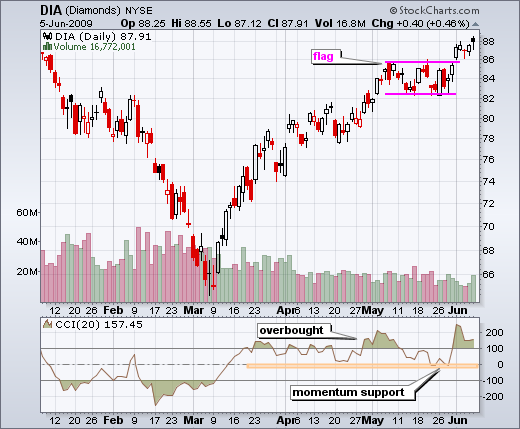
Even thought the Dow Diamonds (DIA) is overbought medium-term, the recent breakout is short-term bullish and this breakout is holding. On the daily chart, DIA broke above flag resistance with a surge on Monday. This move pushed CCI above 100 to turn momentum overbought... Read More