ChartWatchers October 18, 2009 at 02:39 PM
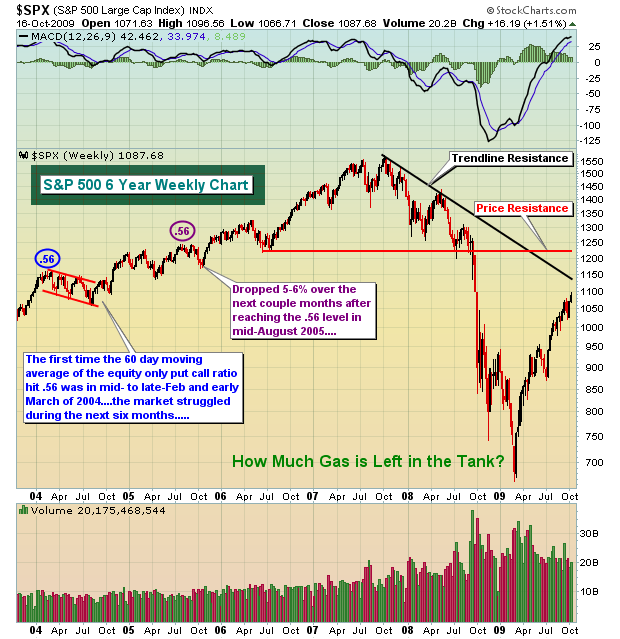
It's very easy to get caught up in the euphoria of this market run. I'd be careful to do that. Invested Central turned from aggressively optimistic to cautiously bullish in early May and we've maintained that more cautious stance since. Call us conservative if you'd like... Read More
ChartWatchers October 18, 2009 at 02:35 PM

In my September 25 article I headlined the fact that the Oil ETF (USO) had generated convincing sell signal, so I think it is appropriate to report that the signal has recently turned to a buy... Read More
ChartWatchers October 17, 2009 at 08:21 PM
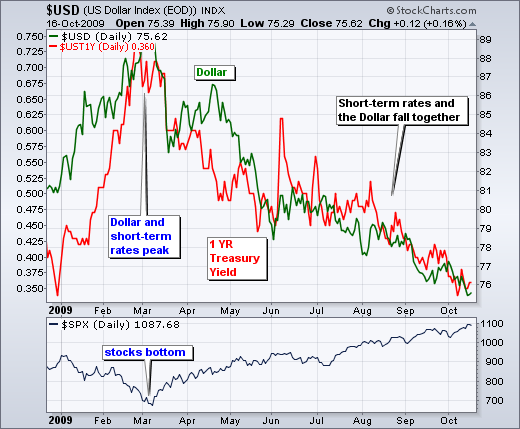
While there has been a negative correlation between the Dollar and stocks this year, there has been a positive correlation between the Dollar and short-term interest rates. The chart below shows the US Dollar Index ($USD) with the 1-Year Treasury Yield ($UST1Y)... Read More
ChartWatchers October 17, 2009 at 07:34 PM
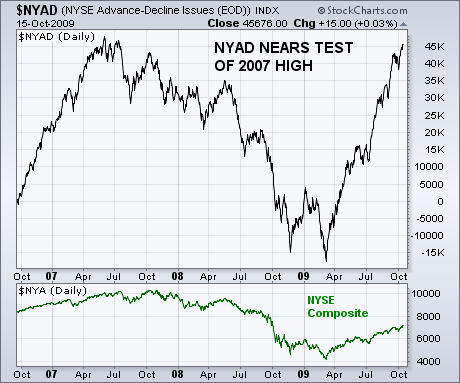
NYSE ADVANCE-DECLINE LINE NEARS OLD HIGH ... One of our readers asked for a look at the NYSE Advance-Decline line, and this may be a good time to start keeping an eye on it. Chart 7 shows the NYAD nearing a test of its 2007 peak... Read More
ChartWatchers October 17, 2009 at 07:31 PM
Internet Connectivity Upgrade Progress Report: On Monday night we moved our site traffic off of our old 180 megabit T3 connections and back onto the gigabit Fiber connection... Read More
ChartWatchers October 17, 2009 at 05:23 PM

This is the next part of a series of articles about Technical Analysis from a new course we're developing. If you are new to charting, these articles will give you the "big picture" behind the charts on our site... Read More
ChartWatchers October 04, 2009 at 04:30 PM

One of the catalysts behind Thursdays heavy stock selling was the breakdown in Treasury bond yields. The 10-Year T-note yield fell below its July low to the lowest level in more than four months. Bond yields are an indicator of confidence in the economy... Read More
ChartWatchers October 04, 2009 at 04:24 PM
I've cautioned recently about the risks of being long in the market. There were too many warning signs. Yes, the market could have kept its head down and pushed to higher levels. But that wouldn't have been the healthy way to extend the recent uptrend... Read More
ChartWatchers October 04, 2009 at 04:20 PM
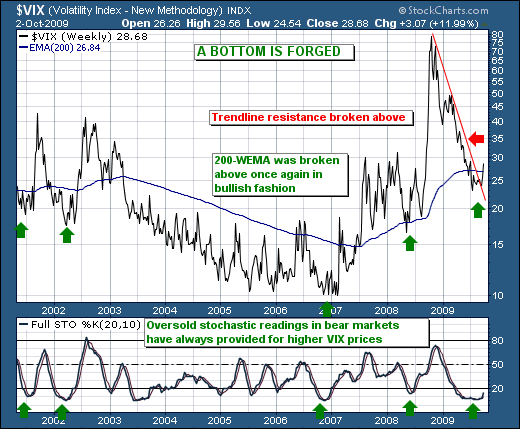
Complacency, complacency and more complacency. While the media worries about a correction in the strong cyclical bull market, they should quite simply be considering whether or not the cyclical bull has indeed topped out and a cyclical bear market has begun... Read More
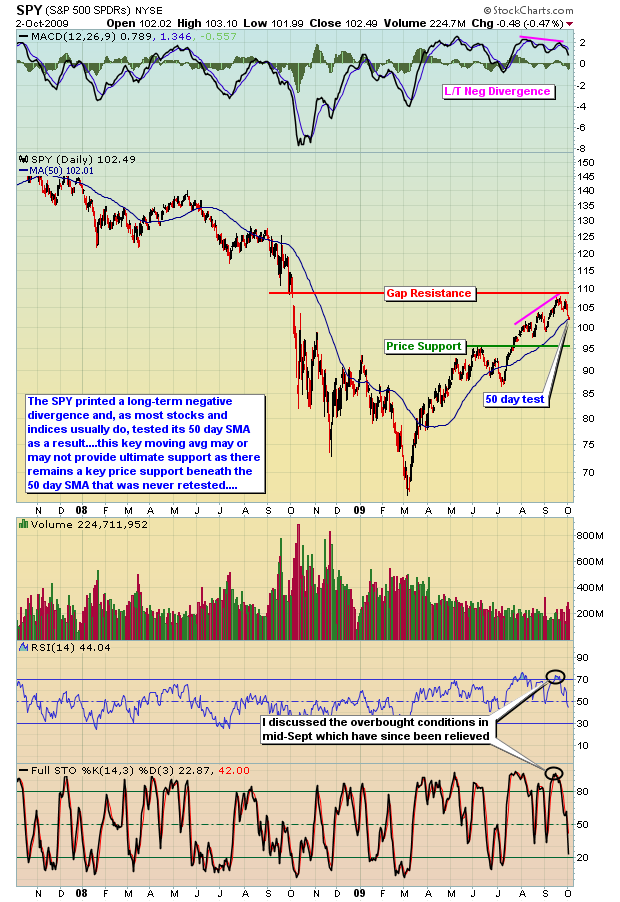
ChartWatchers October 04, 2009 at 04:11 PM
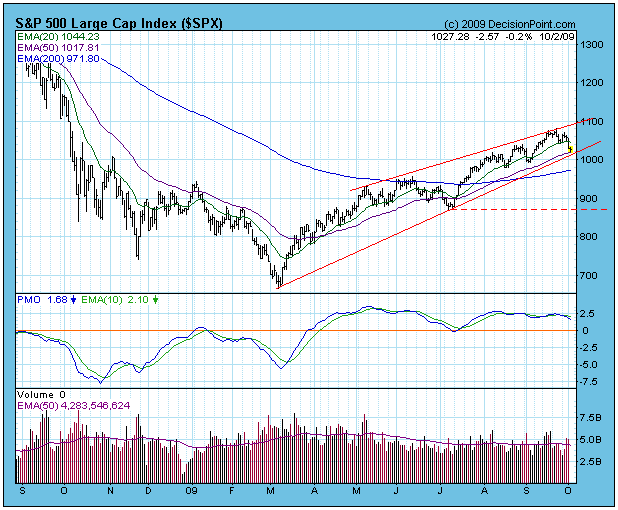
The market has begun another correction, but so far no serious technical damage has been done. The S&P 500 remains within the grasp of an ascending wedge formation, the dominant feature on the daily chart... Read More
ChartWatchers October 04, 2009 at 02:02 PM
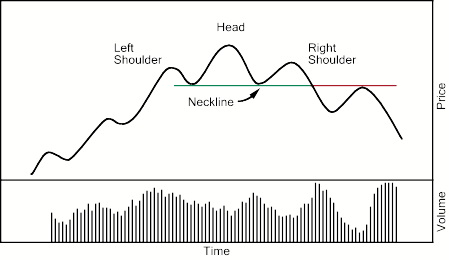
This is the next part of a series of articles about Technical Analysis from a new course we're developing. If you are new to charting, these articles will give you the "big picture" behind the charts on our site... Read More
ChartWatchers October 04, 2009 at 01:13 PM
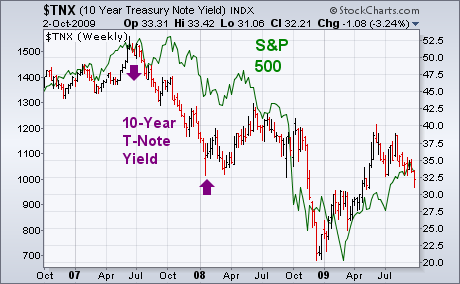
One of the catalysts behind Thursdays heavy stock selling was the breakdown in Treasury bond yields. The 10-Year T-note yield fell below its July low to the lowest level in more than four months. Bond yields are an indicator of confidence in the economy... Read More
ChartWatchers October 03, 2009 at 07:54 AM
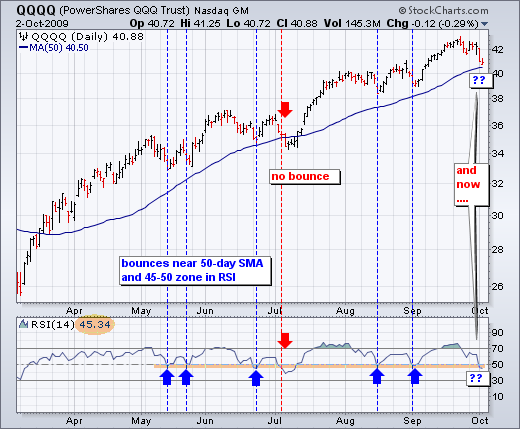
With a sharp decline over the last eight days, the Nasdaq 100 ETF (QQQQ) is testing support from the rising 50-day moving average and RSI is testing support around 45-50... Read More