ChartWatchers May 24, 2010 at 08:08 AM
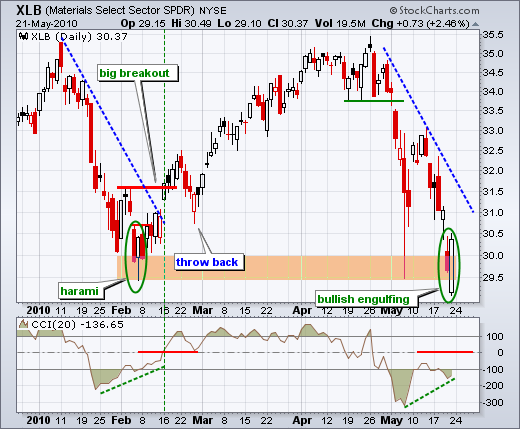
The Materials SPDR (XLB) was one of the hardest hit sector SPDRs over the last four weeks. After a 15+ percent decline, the ETF is testing support from the February low. A big bullish engulfing pattern formed on Friday as the ETF opened weak and closed strong... Read More
ChartWatchers May 23, 2010 at 01:47 PM
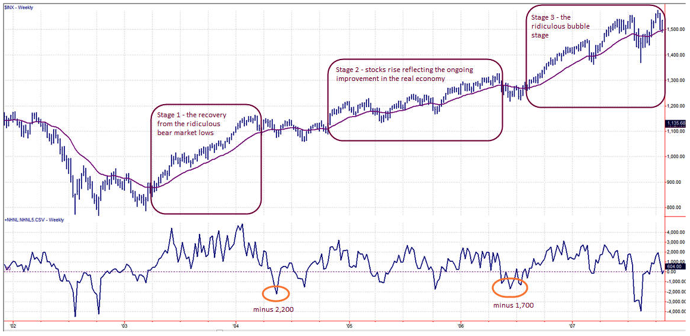
The tremendous market volatility is stressing many traders. My approach to tense situations is to push back a bit, look at the big picture, and then return to shorter-term charts for making tactical decisions... Read More
ChartWatchers May 23, 2010 at 01:28 PM
Hello Fellow ChartWatchers! One of the more unexpected pieces of feedback that I've gotten as I have travelled around recently is that some people aren't reading our free Blog Articles because they associate blogs with rumor, innuendo, amateur writing, and lots of false informati... Read More
ChartWatchers May 22, 2010 at 02:29 PM
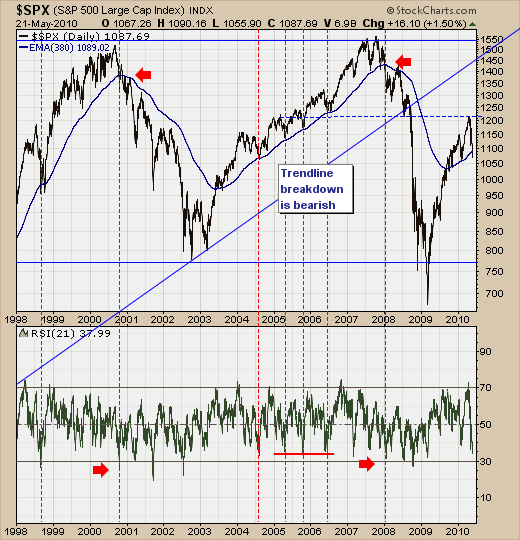
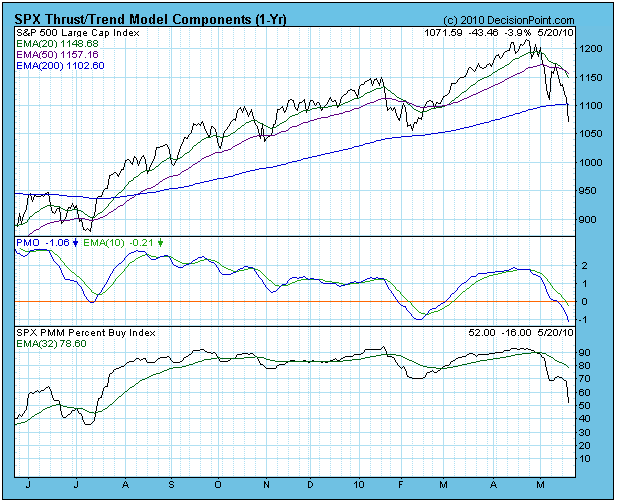
The S&P 500 decline over the past several weeks has reached a critical junction point in the decline at the 380-day exponential moving average support level... Read More
ChartWatchers May 22, 2010 at 02:25 PM
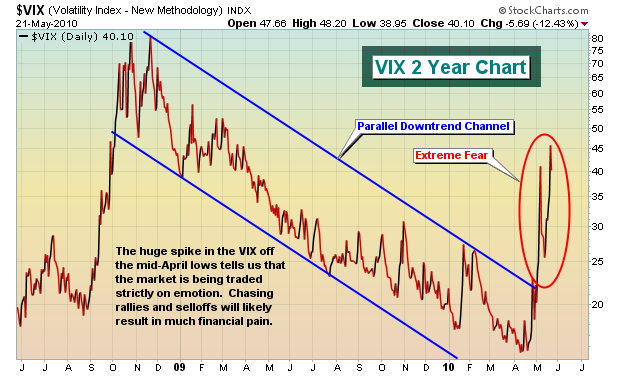
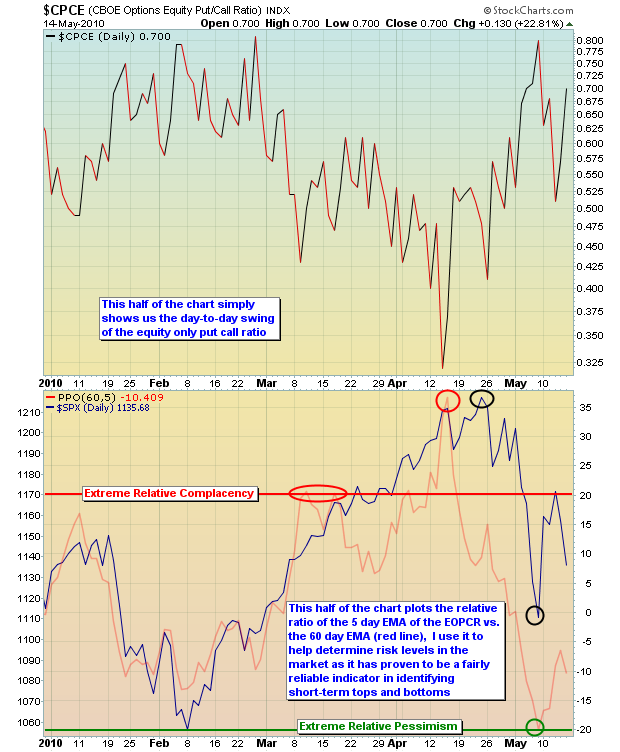
Many traders look at volatility and think huge potential rewards. I look at it and think huge potential risks. I know I'm conservative, but it's two different ways of viewing the same market... Read More
ChartWatchers May 21, 2010 at 08:48 PM

In early April, I expressed the view that the rally in the U.S. Dollar Index was coming mainly from weaker European currencies which meant that the dollar rally wasn't as widespread as it appeared... Read More
ChartWatchers May 21, 2010 at 08:28 PM
With the market in a dizzying decline, some of our subscribers are wondering why our market posture is only neutral... Read More
ChartWatchers May 15, 2010 at 08:59 PM
Global stock markets have been quite volatile of late and significant gap ups and gap downs are becoming the norm. While trading gaps may seem impossible at times, there is good news technically from the market selloff that resulted from the debt crisis in Europe... Read More
ChartWatchers May 15, 2010 at 06:50 AM
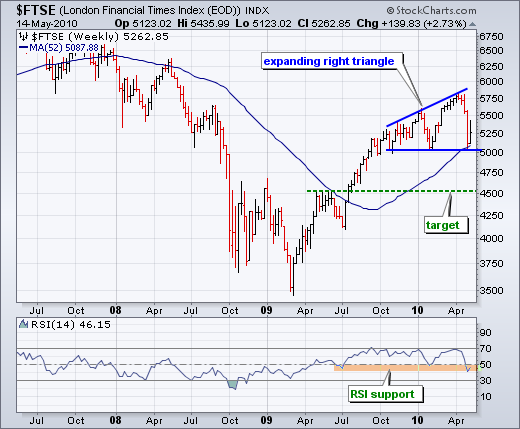
The London FTSE ($FTSE) has an expanding right triangle working over the last 7-8 months. These are akin to broadening formations, which are also bearish reversal patterns... Read More
ChartWatchers May 01, 2010 at 08:23 PM
Hello Fellow ChartWatchers! There is a TON of great stuff happening at StockCharts.com right now. First off, I want to make sure that everyone is aware that our SPRING SPECIAL is going on right now... Read More
ChartWatchers May 01, 2010 at 03:41 PM
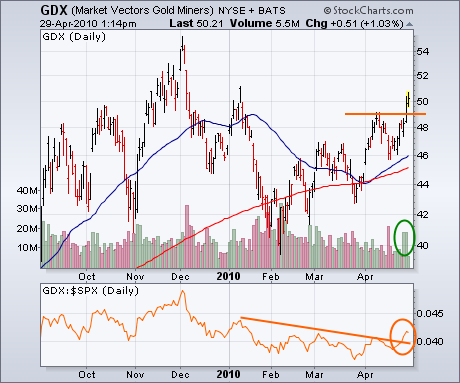
Three Thursdays ago (April 8), I wrote about the upturn in the price of gold and gold stocks. At the time, gold was breaking through a bullish "neckline" in a head and shoulders bottom while the Gold Miners Index was breaking through its March high... Read More
ChartWatchers May 01, 2010 at 03:39 PM
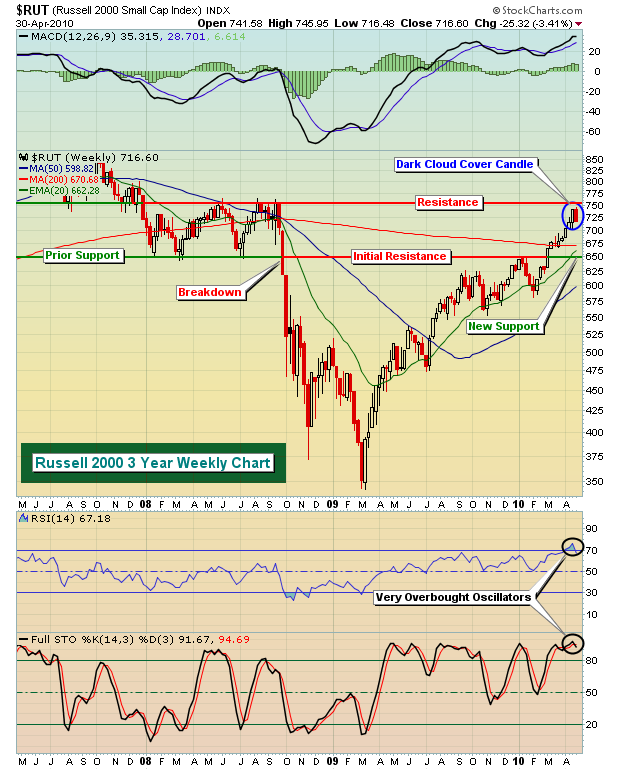
In my last article I suggested the financials were topping and that would make any further advance in the market difficult. Well this past week the action on the NASDAQ and Russell 2000, home of the high beta stocks, confirmed the bearish action... Read More
ChartWatchers May 01, 2010 at 03:32 PM
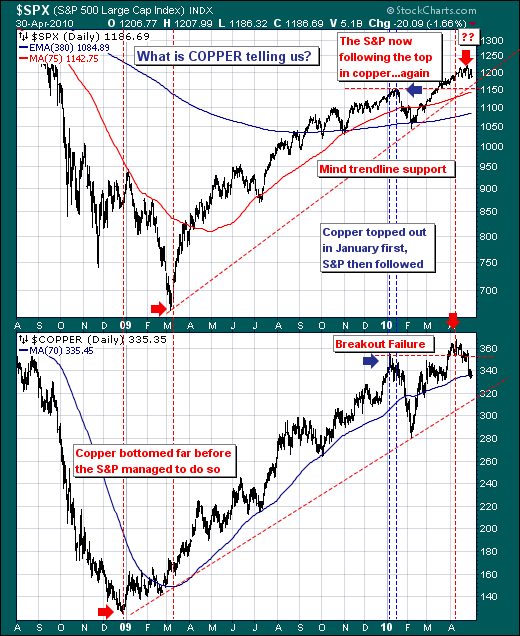
We are rather interested in the manner Copper is trading at present, for Copper has shown itself in recent months to be a leading indicator of the path of the S&P 500... Read More
ChartWatchers May 01, 2010 at 08:01 AM
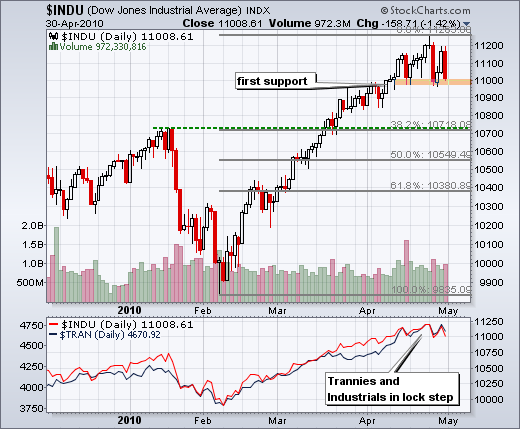
With the third long red candlestick in three weeks, the Dow Industrials is once again testing support in the 11000 area. The senior average first exceeded 11000 on April 14th and then moved into a trading range... Read More
ChartWatchers May 01, 2010 at 04:51 AM
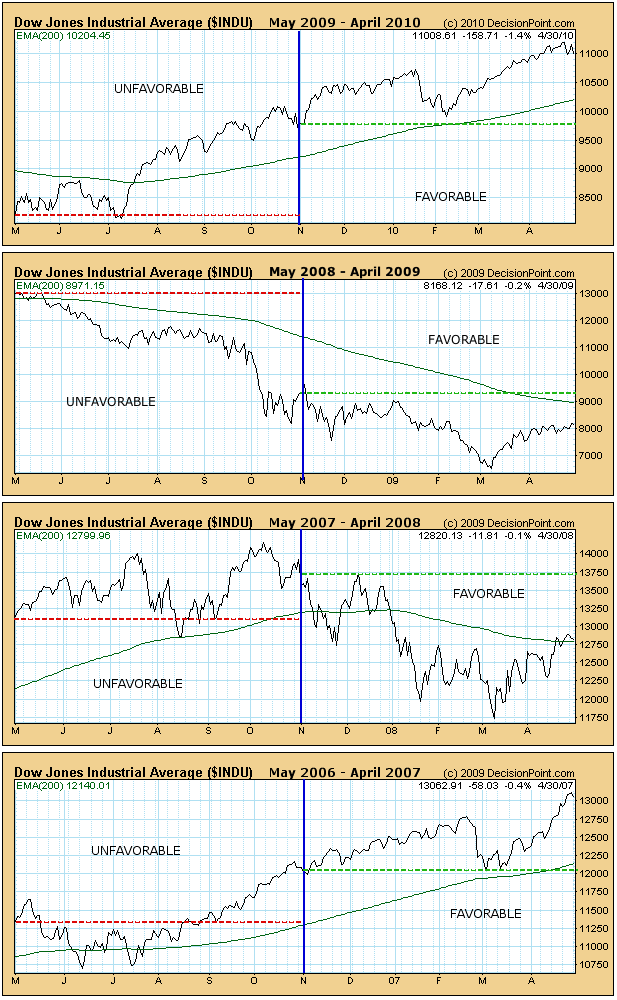
SIX-MONTH SEASONALITY: Research published by Yale Hirsch in the Trader's Almanac shows that the market year is broken into two six-month seasonality periods... Read More