ChartWatchers November 20, 2010 at 10:55 PM
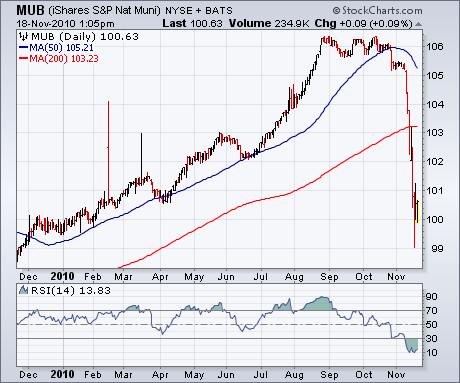
We've been showing the upward trend in bond yields since the Fed's latest QE2 package was announced last week. We've also shown the drop in bond prices, especially Treasury bonds and notes. The bond category that's been hit the hardest has been tax-exempt municipal bonds... Read More
ChartWatchers November 20, 2010 at 10:43 PM
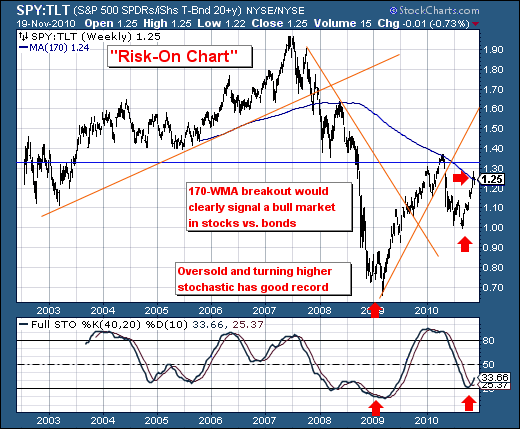
Happy Thanksgiving! We view the ratio between stocks and bonds as a barometer for the "risk-on" or "risk-off" trade... Read More
ChartWatchers November 20, 2010 at 10:38 PM
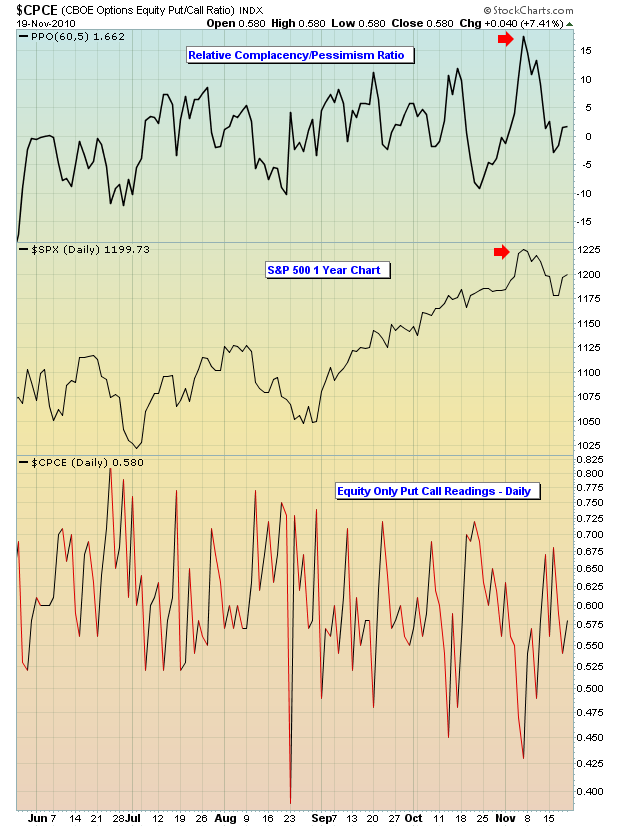
The top in April was laced with warning signs, from record complacency to negative divergences on daily and weekly MACDs to underperforming financials to overbought oscillators to oversold bonds... Read More
ChartWatchers November 20, 2010 at 07:46 PM
Hello Fellow ChartWatchers! We are now halfway through our current plan for adding more value to every StockCharts.com subscriber's membership... Read More
ChartWatchers November 20, 2010 at 01:11 PM
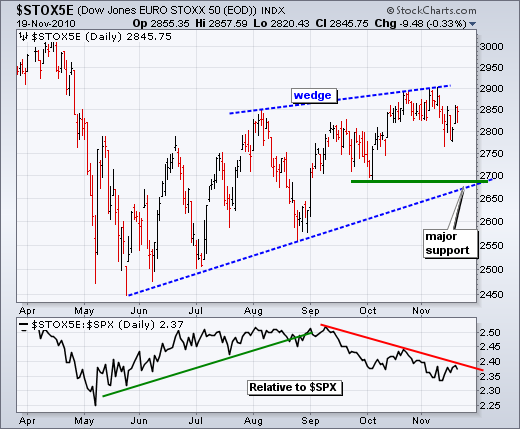
Despite weakness in the Euro and European debt concerns, we have yet to see significant weakness or a breakdown in the DJ Euro Stoxx 50 ($STOX5E). This index is the Dow Industrials of Europe. There are 50 stocks representing 9 countries and 18 industry groups... Read More
ChartWatchers November 19, 2010 at 08:32 PM

According to our mechanical timing models, as well as my conclusions through visual analysis, we are in a bull market, a cyclical bull market, which refers to the bull/bear cycle that occurs about every four years... Read More
ChartWatchers November 06, 2010 at 09:35 PM
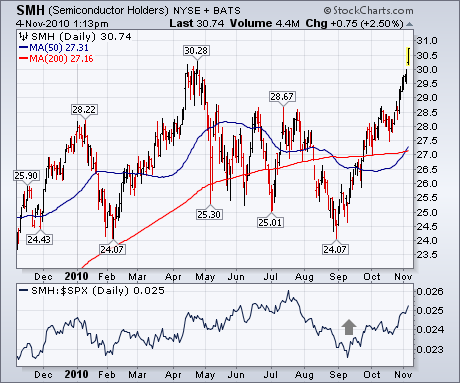
The ability of any stock index or group to clear its April high is a sure sign of strength. In case you haven't noticed, the Semiconductor Holders are doing just that today. I point that out because, up until a couple of months ago, chip stocks were market laggards... Read More
ChartWatchers November 06, 2010 at 09:23 PM
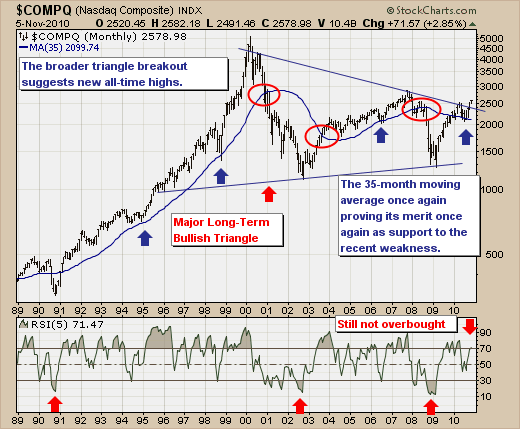
With the "troika" of the US mid-term elections, FOMC meeting decision on QE-2, and the US Employment Situation Report having been digested by the markets, we thought it instructive to step back and take a longer-term viewpoint of the NASDAQ Composite... Read More
ChartWatchers November 06, 2010 at 09:22 PM
It's been a breathtaking move. The NASDAQ was trading near the 2100 level at the end of August. Friday it closed at 2579. That's more than a 25% move in just over two months. Of course that followed a 17% decline from April through August... Read More
ChartWatchers November 06, 2010 at 07:46 PM
Hello Fellow ChartWatchers! One of the things we are always trying to do here at StockCharts is "improve." We are always trying to make the website better - faster, more powerful, more flexible, you name it. We are also always trying to increase its value... Read More
ChartWatchers November 06, 2010 at 08:44 AM
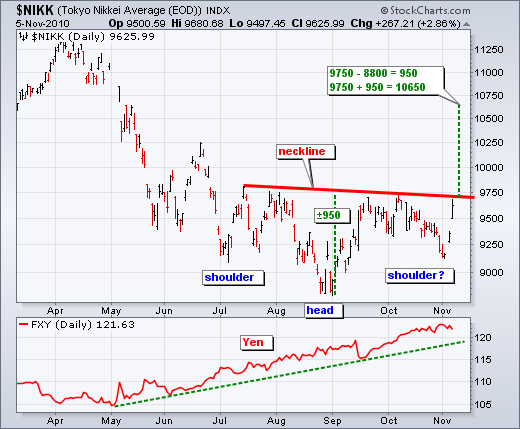
Although a little late to the party, the Nikkei 225 ($NIKK) is showing signs of life with an inverse head-and-shoulders pattern taking shape... Read More
ChartWatchers November 05, 2010 at 04:15 PM
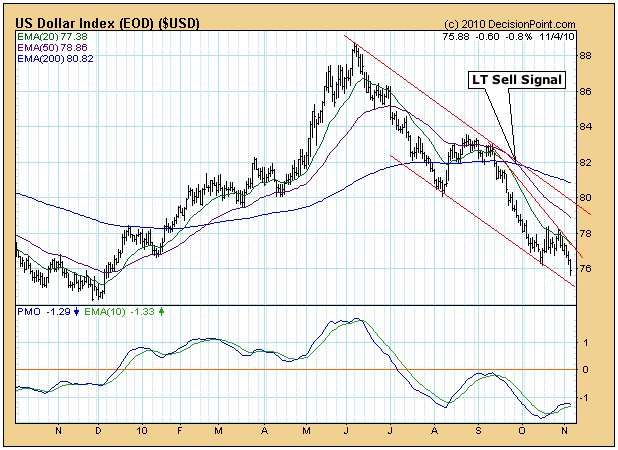
(This is an excerpt from Friday's blog for Decision Point subscribers.) As of 7/14/2010 the US Dollar has been on a Trend Model NEUTRAL signal, and it has been in a bear market since the end of September when the 50-EMA crossed down through the 200-EMA... Read More