ChartWatchers December 18, 2010 at 07:44 PM
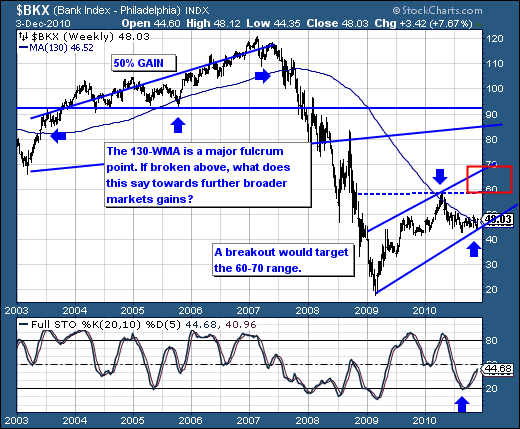
We have written several messages of late about the recent upturn in financial stocks that had been lagging behind the rest of the market since the spring. I expressed the view that a sustained upturn in the stock market was unlikely without some help from the financial sector... Read More
ChartWatchers December 18, 2010 at 07:41 PM
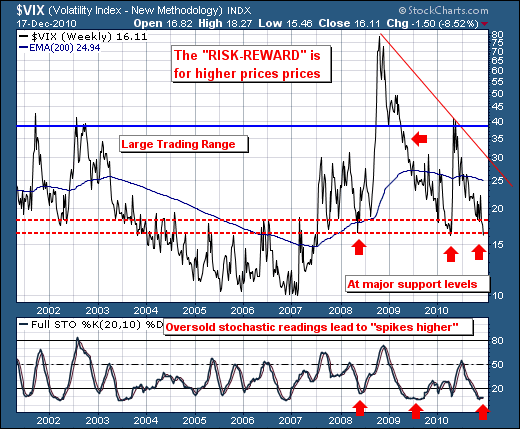
Happy Holidays! The recent rally off the late-August low has begun to encounter sluggish internals, which leads one to believe that the market shall be poised correct in the weeks and perhaps even months ahead... Read More
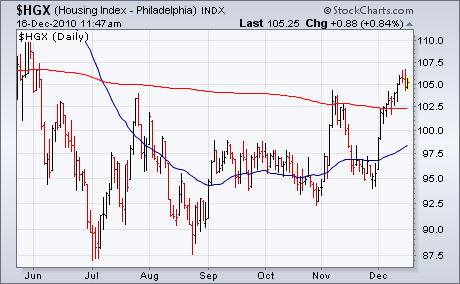
ChartWatchers December 18, 2010 at 07:30 PM
It's hard to believe another year is coming to an end. Outside of a few scary weeks, the stock market performed well in 2010 and heads toward 2011 with a lot of bullish momentum... Read More
ChartWatchers December 18, 2010 at 02:26 PM
Hello Fellow ChartWatchers! Another year has come and gone... Read More
ChartWatchers December 18, 2010 at 05:43 AM
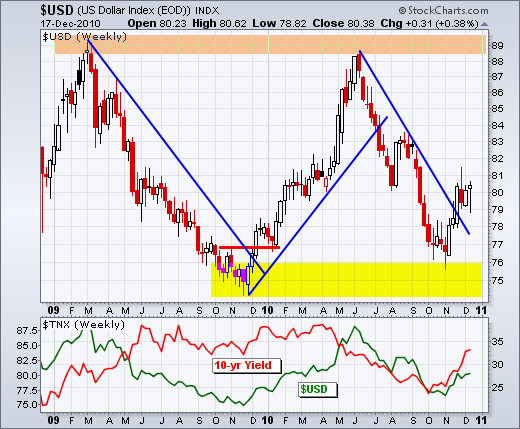
The US Dollar Index ($USD) remains within a long-term trading range, but the swing within that range is up after the November breakout. More importantly, the breakout is holding and rising rates are boosting the greenback... Read More
ChartWatchers December 17, 2010 at 07:10 PM
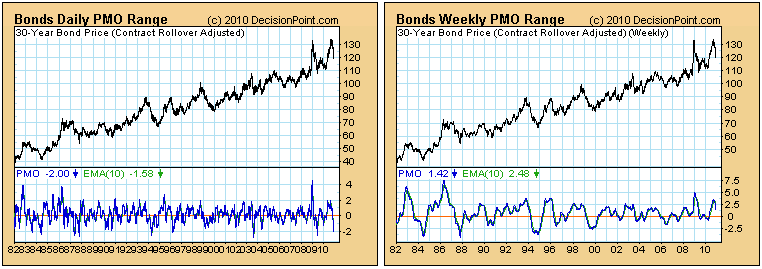
Bonds are in a "waterfall" decline, and some people are beginning to wonder where the bottom will be. A subscriber comments: "I'm always anxious to see the reaction time of the DP Trend Model as compared to what I look for in the momentum of the primary trend... Read More
ChartWatchers December 04, 2010 at 11:50 PM
Complacency was the big issue for stock market bulls as we entered the second week of November. The market simply ran too far too fast and everyone began piling in on the equity calls as if the buying would never end... Read More
ChartWatchers December 04, 2010 at 02:58 PM
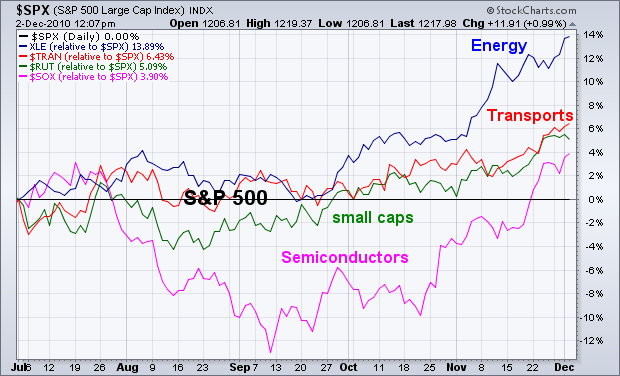
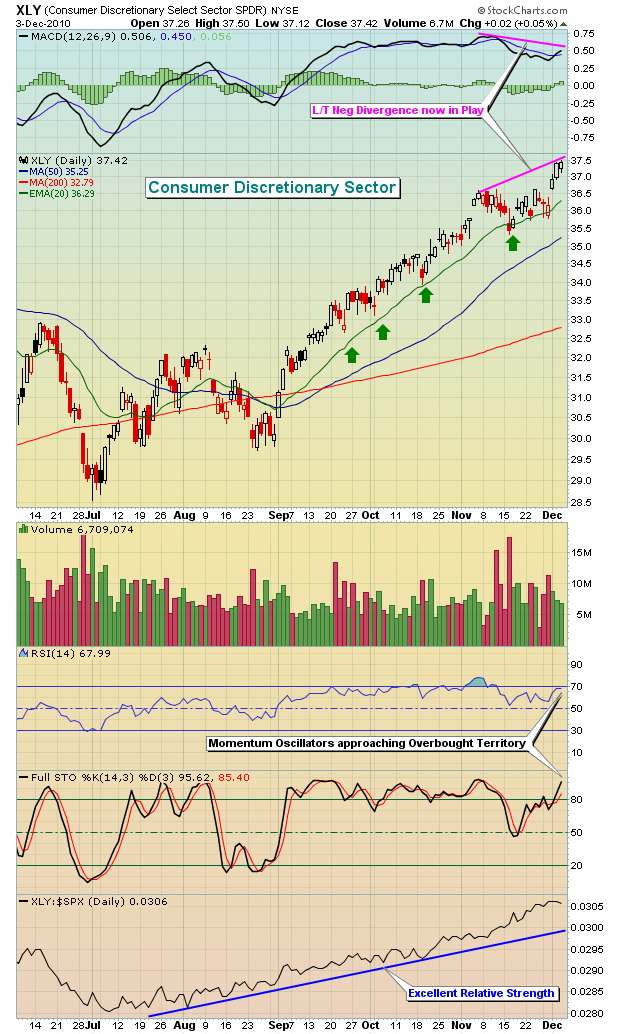
A way to determine whether or not investors are turning more optimistic on the economy (and stock market) is to study the trend of recent sector rotations. In an improving economy, investors tend to favor economically-sensitive stock groups... Read More
ChartWatchers December 04, 2010 at 02:46 PM
The past several day market rally has caught many "flat-footed" to be sure as traders head into year-end. Moreover, the prospects for further gains are rather high; hence we're likely to see many traders attempt to play "catch-up"... Read More
ChartWatchers December 04, 2010 at 02:40 PM
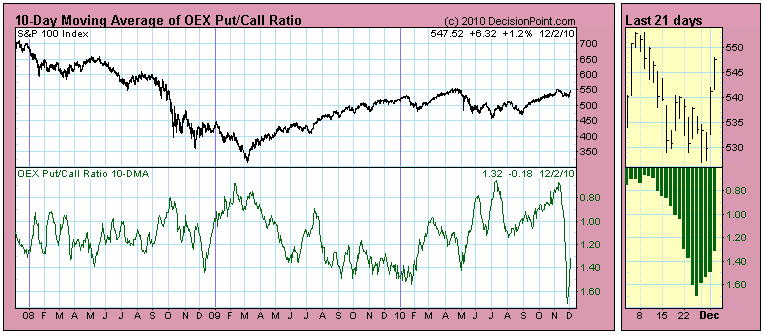
Last week some subscribers asked me what was going on with the OEX Put/Call Ratio. You can see on the 10-Day Moving Average chart that it took a sharp dive off the November price top... Read More
ChartWatchers December 04, 2010 at 09:04 AM
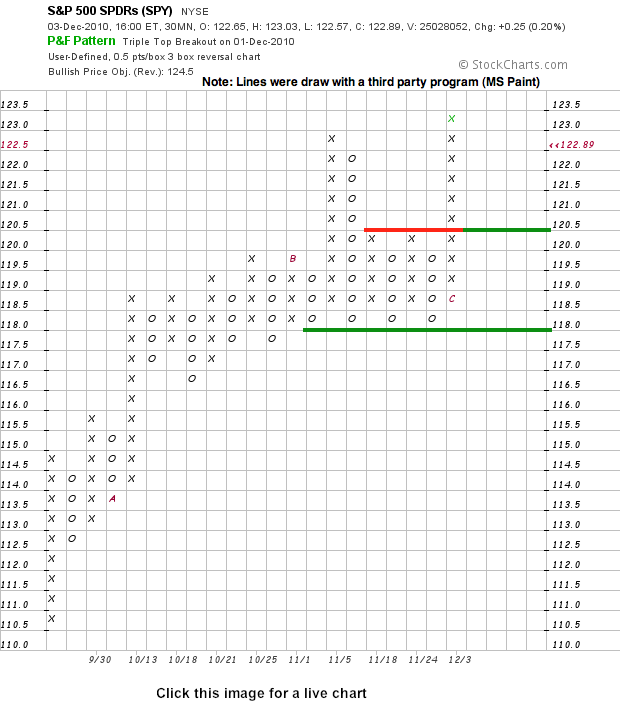
Point & Figure produce straight-forward charts that focus exclusively on price action. Columns of X's appear during an advance. Columns of O's appear during a decline. Nothing appears when prices are flat or move less than the box size or reversal amount... Read More