ChartWatchers February 19, 2011 at 09:51 PM
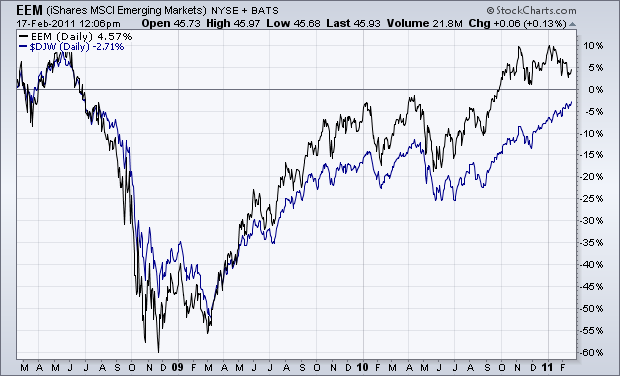
I'm not a believer in global decoupling. On the contrary, I believe that global stock markets are highly correlated and usually trend in the same direction. That's especially true of the relationship between emerging and developed markets... Read More
ChartWatchers February 19, 2011 at 09:48 PM
Richard Rhodes is on hiatus this week... Read More
ChartWatchers February 19, 2011 at 09:47 PM
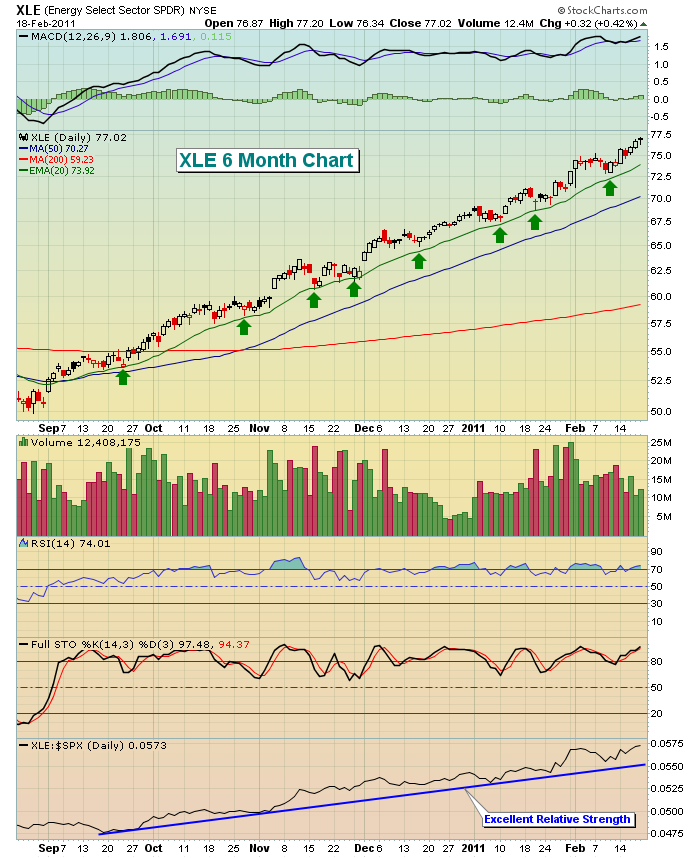
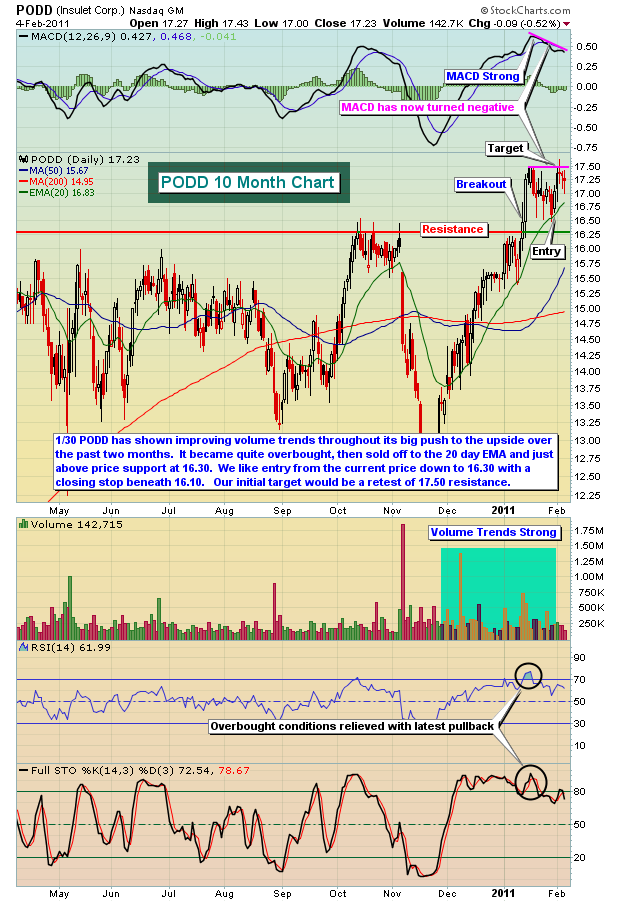
One thing that's been quite apparent to me over the past several months is that money is not leaving the equity market. When one sector or industry group sells off, the money simply rotates elsewhere. Then rinse and repeat... Read More
ChartWatchers February 19, 2011 at 09:43 PM
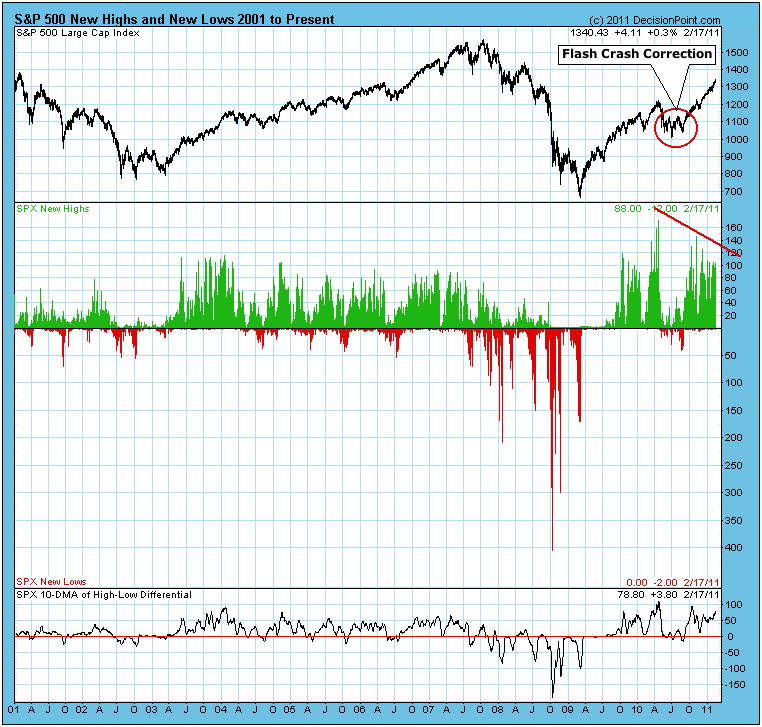
The daily number of New Highs and New Lows (NHNL) refers to stocks reaching their highest or lowest price during the most recent 52-week period. Below is a NHNL chart for the stocks that compose the S&P 500 Index, and we can learn a few things from it... Read More
ChartWatchers February 19, 2011 at 05:38 AM
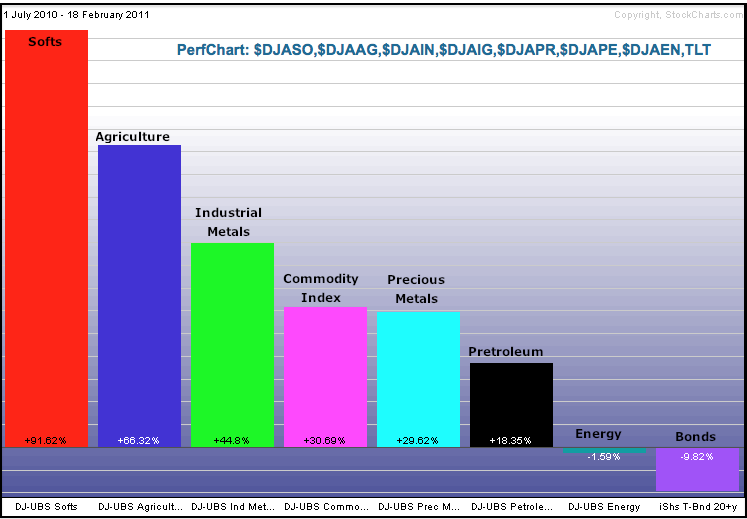
Except for natural gas, most major commodities and commodity groups are up sharply over the last 6-8 months. Stockcharts.com provides a broad range of Dow Jones-UBS commodity related indices... Read More
ChartWatchers February 05, 2011 at 08:52 PM
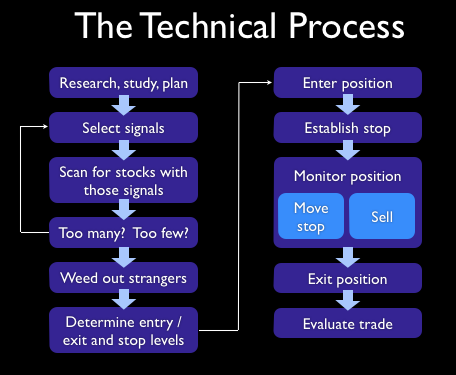
Hello Fellow ChartWatchers! As I travel around the country talking to various investment groups, I always make a point to remind everyone about the what I call "The Technical Process" - the steps that every investor goes through before taking a position in a stock... Read More
ChartWatchers February 05, 2011 at 04:19 PM
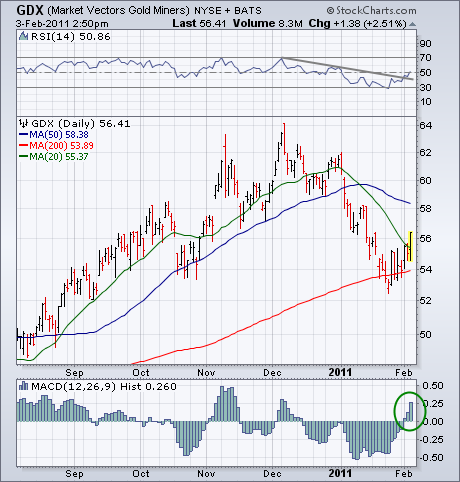
My Tuesday message showed the Market Vectors Gold Miners ETF (GDX) testing long-term support at its 200-day moving average, and suggested watching it closely for signs of an upturn. Today's strong rally in precious metals assets may be the start of that upturn... Read More
ChartWatchers February 05, 2011 at 04:14 PM
While the US markets power towards higher highs – although in a weak manner we might add, we've begun to see outflows of funds from the Emerging Markets... Read More
ChartWatchers February 05, 2011 at 04:08 PM
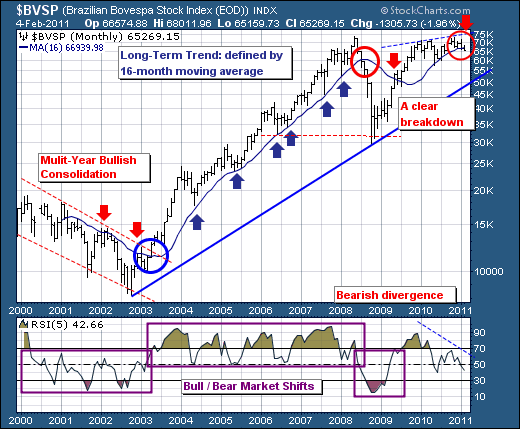
Attempting to short this market prior to any significant breakdown is the equivalent of financial suicide. Taking profits occasionally, moving into cash, and awaiting entry on a new position is fine. But shorting this uptrend with hopes of a big reversal just makes no sense... Read More
ChartWatchers February 05, 2011 at 04:04 PM
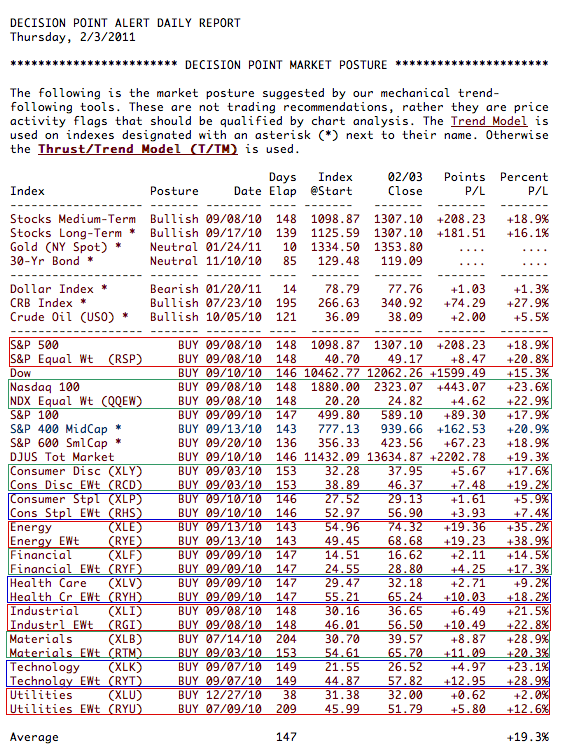
(This is an excerpt from Monday's blog for Decision Point subscribers.) One of the things I constantly flog in this blog is that equal-weight indexes usually perform better than cap-weighted indexes... Read More
ChartWatchers February 05, 2011 at 08:45 AM
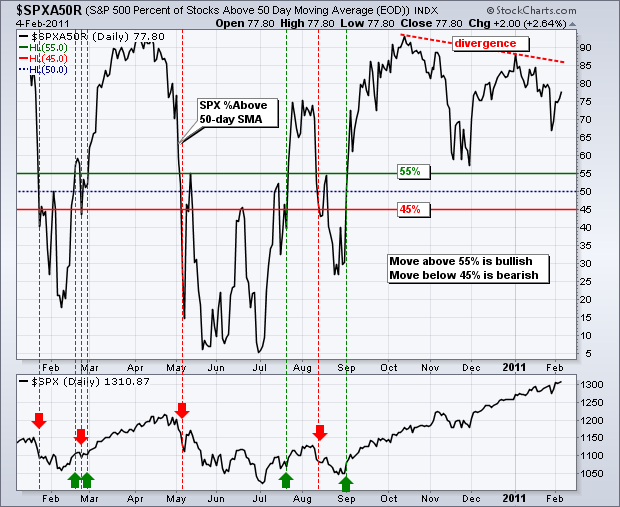
The S&P 500 %Above 50-day SMA ($SPXA50R) indicator is a breath gauge that measures the degree of participation. In this instance, the indicator tells us the percentage of S&P 500 stocks that are above their 50-day SMAs... Read More