ChartWatchers April 17, 2011 at 04:21 PM
Hello Fellow ChartWatchers! We get lots of great feedback from our users and I review much of it. Over the years, certain patterns emerge from the messages we get... Read More
ChartWatchers April 17, 2011 at 02:17 PM
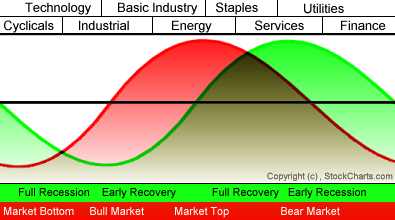
My Tuesday message talked about how sectors rotate near market tops. I explained that market leadership by materials and energy (which carries inflationary expectations) is often a sign of market that's in need of a correction or a consolidation... Read More
ChartWatchers April 17, 2011 at 02:15 PM
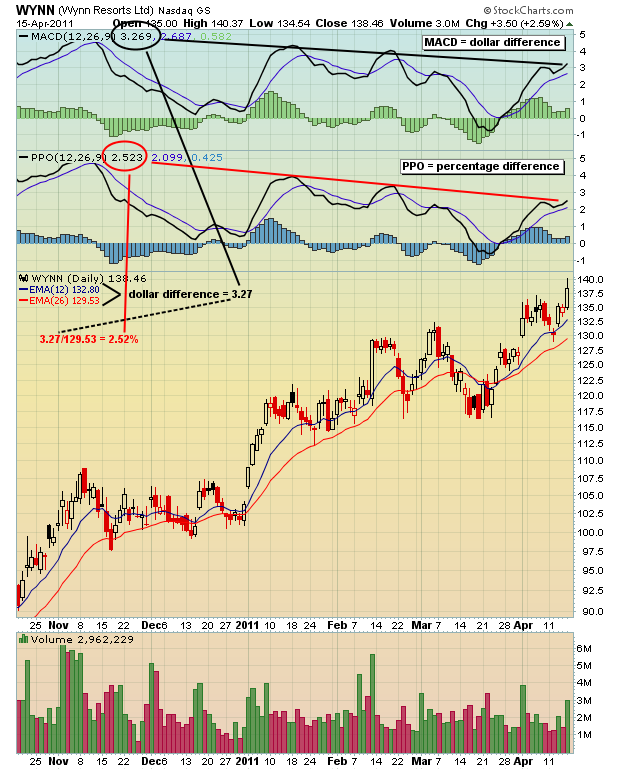
If you plot the Percentage Price Oscillator (PPO - 12,26,9) on an index or individual stock chart next to the MACD (12,26,9), you'll find that they appear to be identical. Let's use Wynn Resorts (WYNN) as an example... Read More
ChartWatchers April 17, 2011 at 02:13 PM
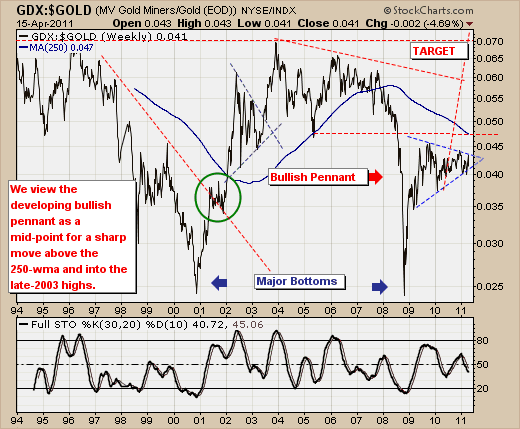
The recent gold price rally to new highs has paled in comparison with silver's seemingly parabolic move higher... Read More
ChartWatchers April 17, 2011 at 02:07 PM
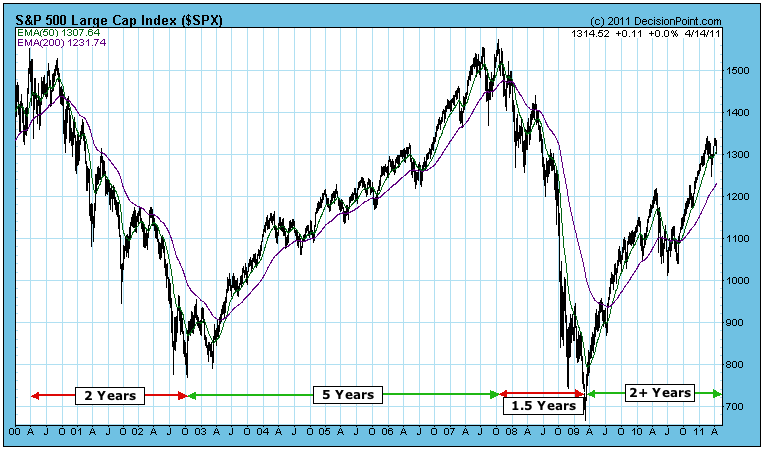
It is a rule-of-thumb that the average bull/bear cycle lasts about four years trough to trough -- 2.5 years of bull market followed by 1.5 years of bear market. Like most of these kinds of rules, it is good to keep them in mind, but don't try to set your watch by them... Read More
ChartWatchers April 16, 2011 at 08:21 AM
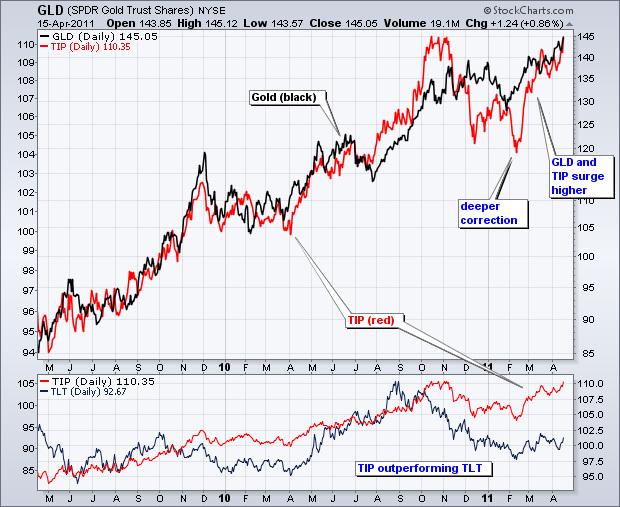
The positive relationship between the Inflation Indexed Bond ETF (TIP) and the Gold SPDR (GLD) went through a rough patch in December-January, but got back on track the last two month. First, note that both remain in clear uptrends... Read More
ChartWatchers April 02, 2011 at 10:02 PM
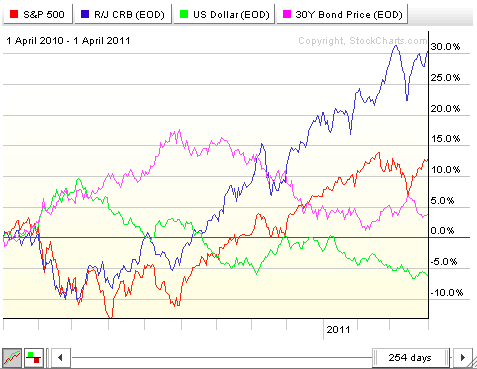
John Murphy has written extensively about Intermarket Analysis - the study of the key relationships between the four major financial markets and how those markets affect each other in the long run... Read More
ChartWatchers April 02, 2011 at 04:12 PM
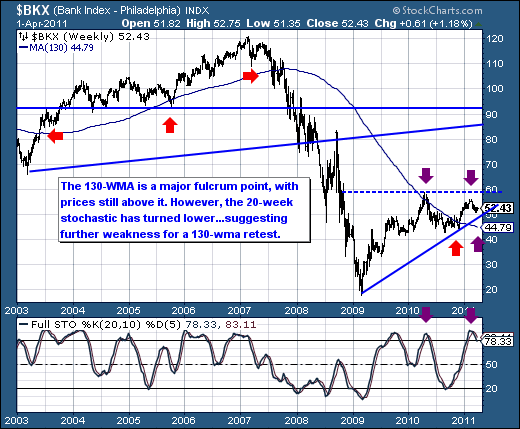
Questions about regarding the quick/sharp rally off the March 16th low. They are numerous, and they consist of a number of troubling circumstances that call into question the veracity of the rally... Read More
ChartWatchers April 02, 2011 at 04:08 PM
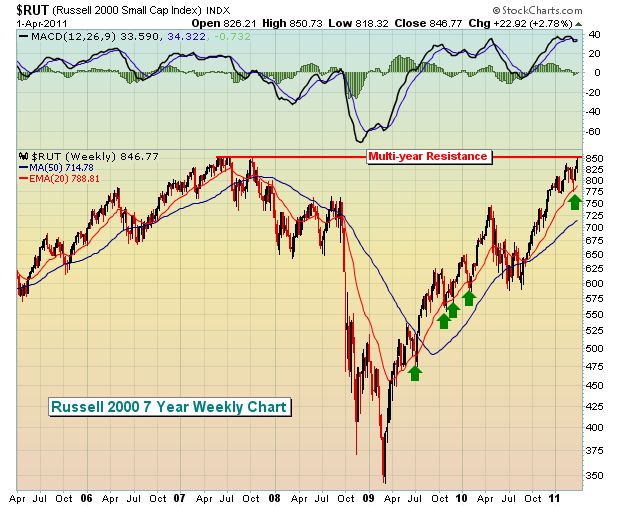
Let's face it. Two weeks ago, the market looked cooked. There didn't appear to be a single drop of gas left in the bulls' tank. We saw impulsive selling. The volume surged on the selling... Read More
ChartWatchers April 02, 2011 at 06:30 AM
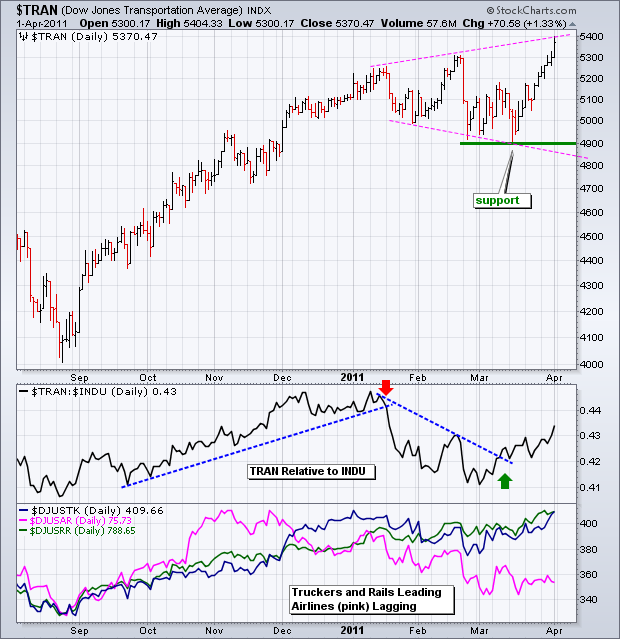
Despite relative weakness in airlines and $108 oil, the Dow Transports surged to a fresh 52-week high on Friday. The chart below shows the Average finding support around 4900 from late February to mid March and then surging around 10% the last 2-3 weeks... Read More
ChartWatchers April 01, 2011 at 05:24 PM
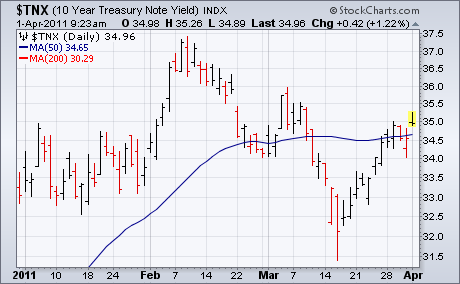
This morning's March jobs numbers reported U.S. payrolls jumping by 218,000 which was higher than estimates. In addition, the unemployment rate declined to a two-year low of 8.8%. The result is a jump in stock futures which points to a higher open today... Read More
ChartWatchers April 01, 2011 at 05:22 PM
(This is an excerpt from Friday's blog for Decision Point subscribers.) If nature abhors a vacuum, technicians abhor "V" bottoms... Read More