ChartWatchers September 15, 2012 at 10:06 PM
The Fed announced that it will purchase $40 billion a month in mortgage backed securities which adds to its holdings of long-term securities and ushers in another round of quantitative easing (QE3). The markets have all reacted in predictable fashion... Read More
ChartWatchers September 15, 2012 at 09:58 PM
Living in the Washington DC area, I'm not sure which was more exciting - QE3 or RG3! The market was set up for higher prices as traders anticipated more quantitative easing. Fed Chairman Bernanke did not disappoint... Read More
ChartWatchers September 15, 2012 at 09:50 PM
Well, finally the past economic/political week has passed, and we find ourselves starting down the barrel of QE-3... Read More
ChartWatchers September 15, 2012 at 07:08 PM
Hello Fellow ChartWatchers! The Fed spoke and the markets took off. StockCharts.com was one of the best places to watch as stocks surged in the wake of the Fed's QE3 announcement... Read More
ChartWatchers September 15, 2012 at 03:51 PM
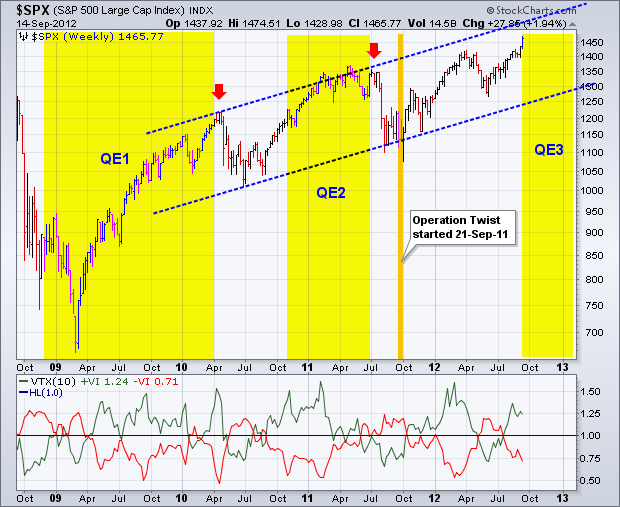
Stocks surged on Thursday after the Fed announced another round of quantitative easing, and extended their gains on Friday. Obviously, the stock market is pleased with the announcement... Read More
ChartWatchers September 01, 2012 at 06:49 PM
Hello Fellow ChartWatchers! Last month we added a feature that many of you have been asking for for a long time - custom technical alerts! Today I want to spend some time showing you how they work and one of the best ways they can be used to help you make better investing decisio... Read More
ChartWatchers September 01, 2012 at 05:56 PM
My Tuesday message expressed the view that if a stock correction were to start, this would be a logical spot for that to happen. That's because several market indexes are testing spring highs, which is a normal spot for chartwatchers to take some profits... Read More
ChartWatchers September 01, 2012 at 05:41 PM
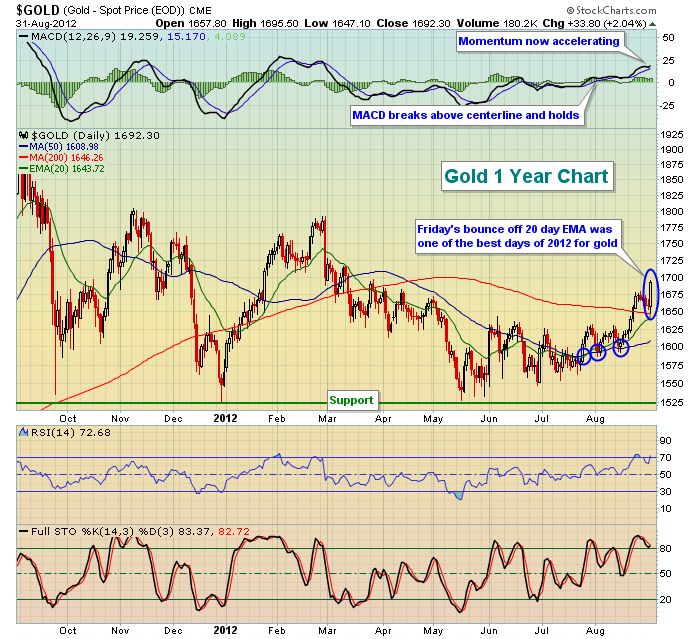
Before I take a look at the bigger picture, there were a couple rather bullish signs on the one year chart for gold the past few weeks. Take a look: After testing descending triangle support (you'll see that in the 5 year chart below) in mid-May, gold began its ascent... Read More
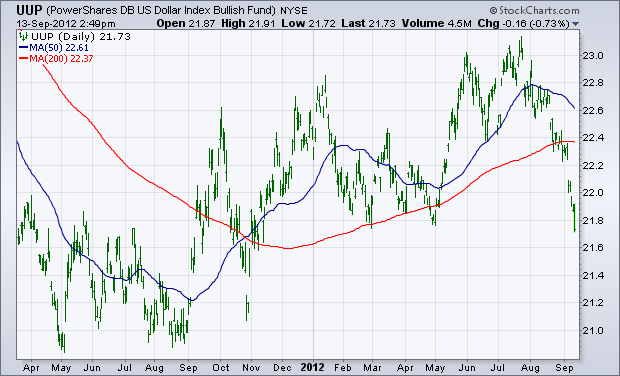
ChartWatchers September 01, 2012 at 05:31 PM

The Canadian mining stocks appear ready to roll over. It is quite surprising that they've not been able to rally given the recent weakness in the US Dollar... Read More
ChartWatchers September 01, 2012 at 05:05 PM
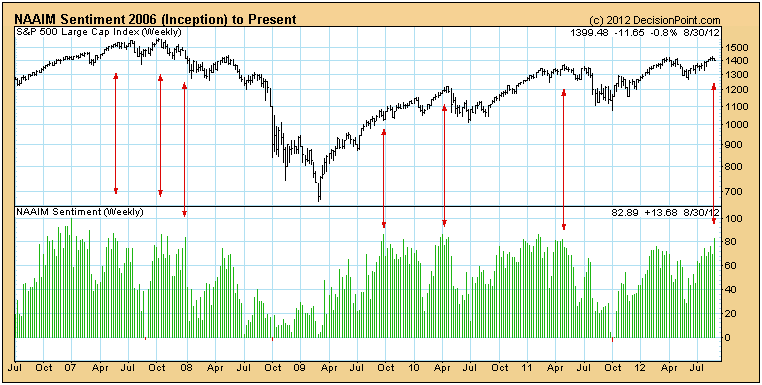
The National Association of Active Investment Managers (NAAIM) weekly poll* shows that they are 83% long. This qualifies as an extreme level of optimism, and should cause concern... Read More
ChartWatchers September 01, 2012 at 07:38 AM
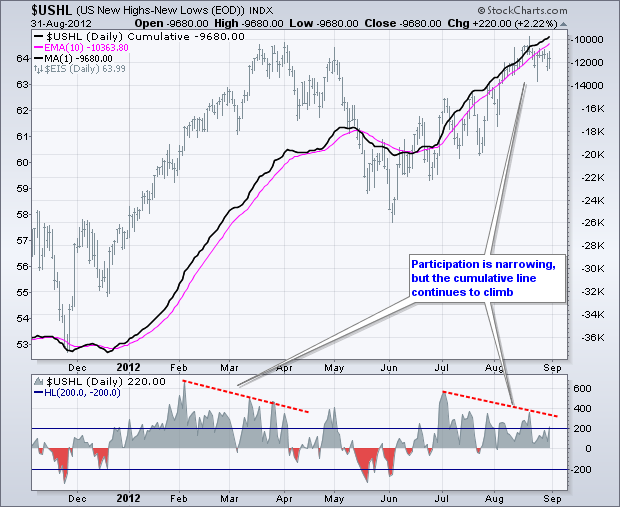
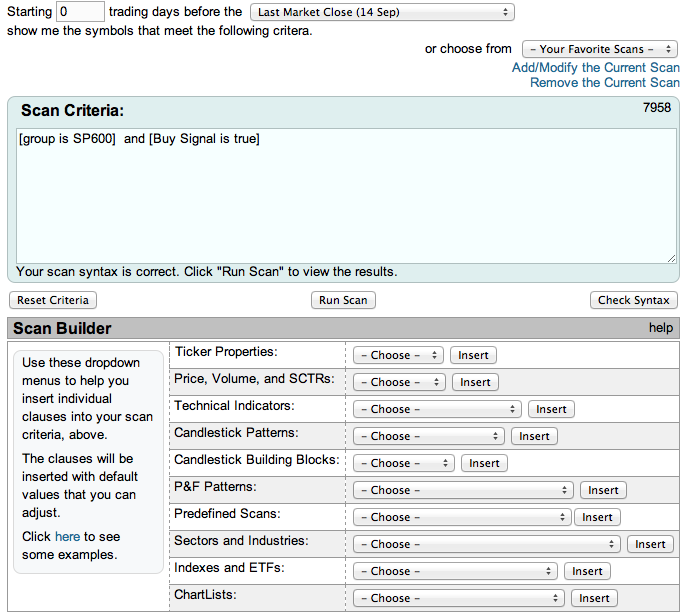
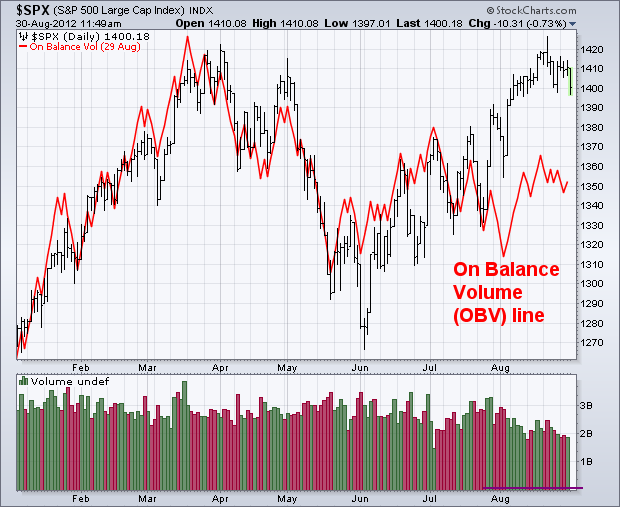
Even though the S&P 1500 Index ($EIS) is trading near its spring highs and within a few percent of a 52-week high, Net New Highs have shown less strength since early July and divergences have formed. Keep in mind that less strength is not the same as weakness... Read More