ChartWatchers February 17, 2013 at 01:42 PM
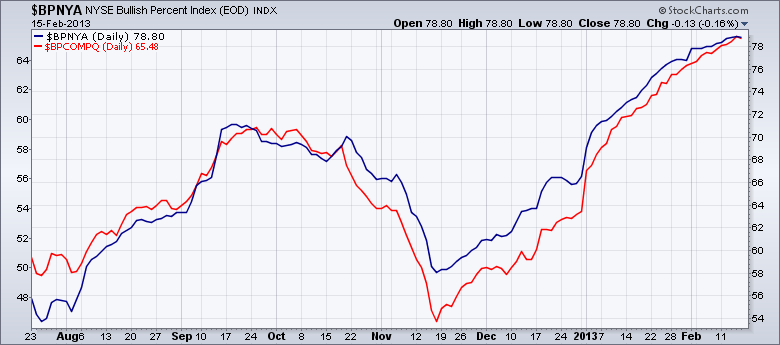
Hello Fellow ChartWatchers! Overlaid charts are a very powerful feature of StockCharts.com. Most people are familiar with using the "Price" Indicator with the "Behind Price" Position setting to create an overlaid chart. (If you aren't, be sure to read this article for more... Read More
ChartWatchers February 16, 2013 at 09:26 PM
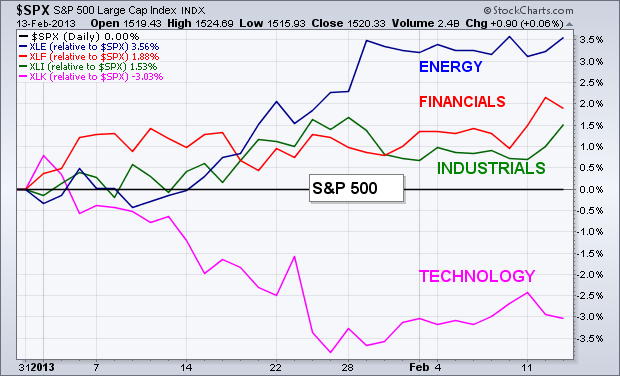
SECTOR LEADERS YEAR TO DATE... Chart 1 plots relative strength ratios of the energy, financial, and industrial sectors versus the S&P 500 (the black zero line). Those three sectors have been the top performers year to date. Technology has been the weakest (on a relative basis)... Read More
ChartWatchers February 16, 2013 at 09:11 PM
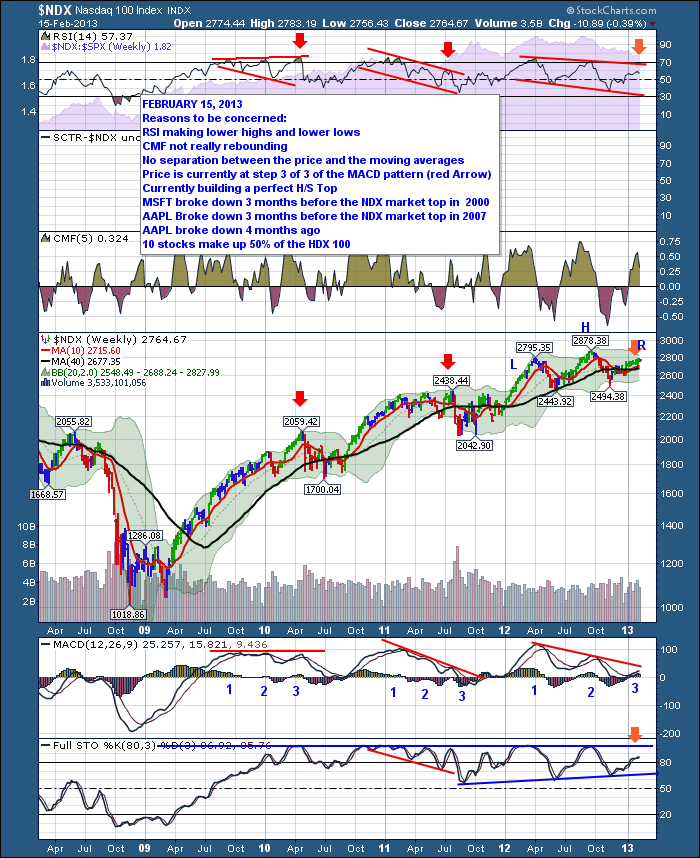
This weekend, I want to talk about the technology sector. Some of the major tops of the market have been spotted on the $NDX before the market breaks down. Here's the chart. It has a lot of data on it. I would encourage you to click on this link $NDX to see a larger version... Read More
ChartWatchers February 16, 2013 at 09:04 PM
I remain bullish for 2013 and believe we could see 1700-1800 on the S&P 500 before the year is over. But I can't deny the short-term warning signs that are showing up everywhere. Let's take the issues one at a time. 1... Read More
ChartWatchers February 16, 2013 at 08:52 PM
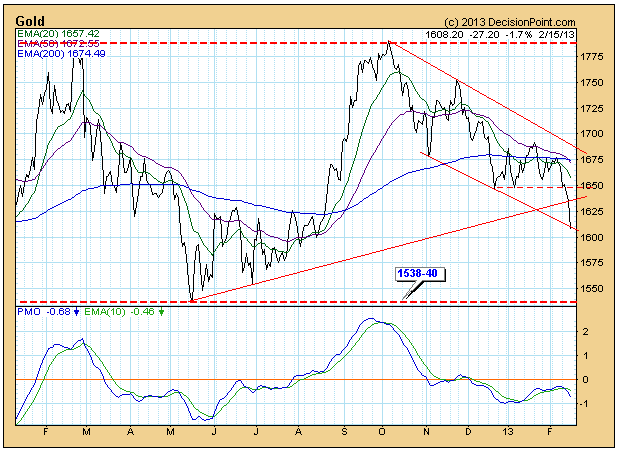
Downward pressure in gold prices continued as very large funds liquidated substantial portions of their positions in the gold ETF (GLD). (See article.) Naturally, we need to look at the charts to give this story some context. (Charts were made before the close... Read More
ChartWatchers February 16, 2013 at 12:46 PM
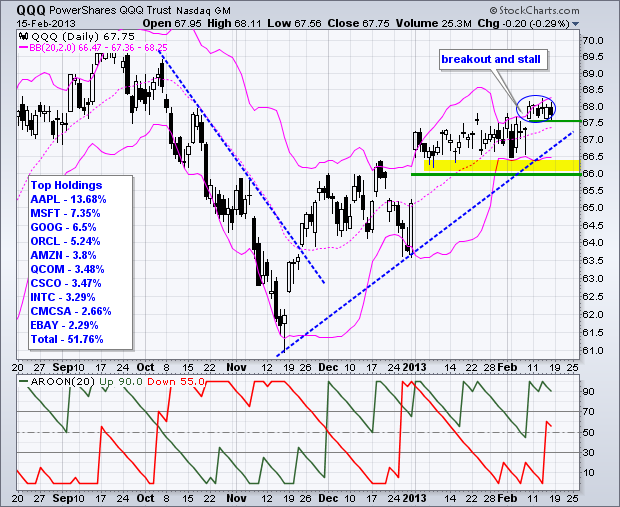
The Nasdaq 100 ETF (QQQ) just can't seem to find its mojo this year, but the 2013 trend is still up and the bulls still have the edge, albeit a slight edge. First, note that QQQ has been trending higher since mid November... Read More
ChartWatchers February 02, 2013 at 10:27 PM
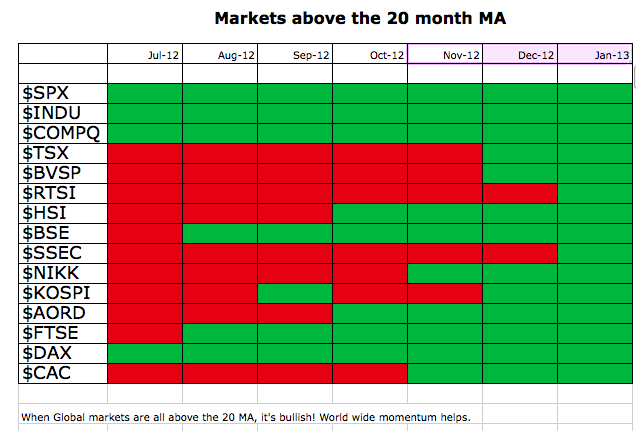
Starting in the summer, some of the global stock markets started to move higher. Once Mario Draghi suggested he would do whatever it takes to save the euro, the European markets have been on a tear higher... Read More
ChartWatchers February 02, 2013 at 06:12 PM
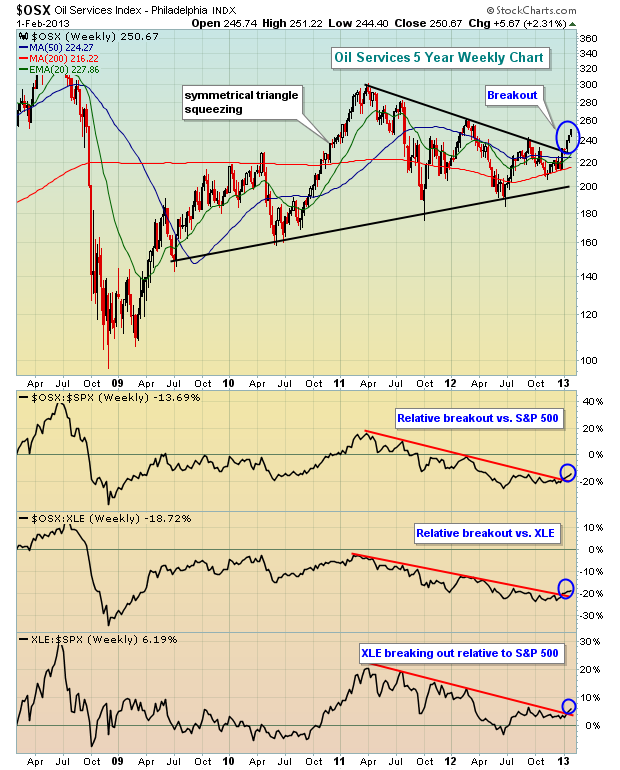
Energy apparently has more fuel in the tank. After underperforming the past couple years, it has rocketed higher to start 2013 and was the leading sector during what was a VERY solid January... Read More
ChartWatchers February 02, 2013 at 06:00 PM
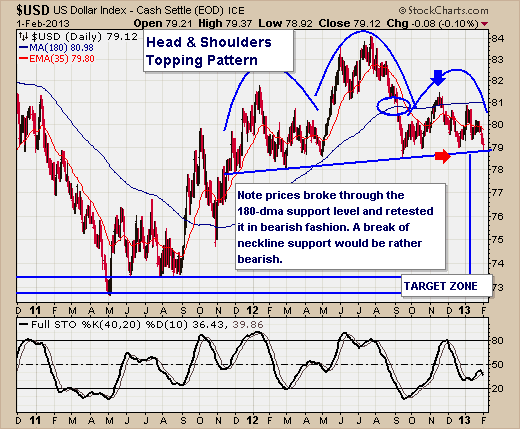
READER QUESTION: I am always curious why you elect to use a surrogate of a market to provide a technical analysis. The one I have a concern with is using UUP to analyze a H&S formation and mention violation of support... Read More
ChartWatchers February 02, 2013 at 04:51 PM
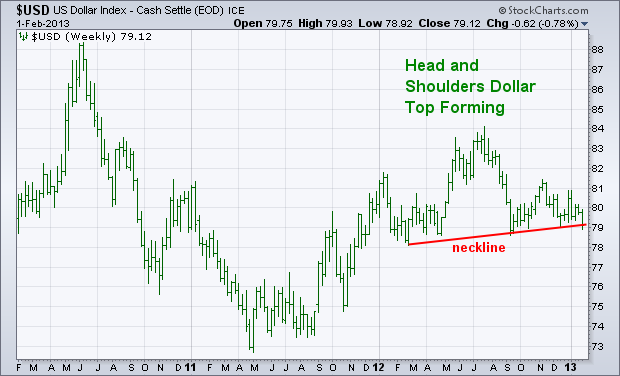
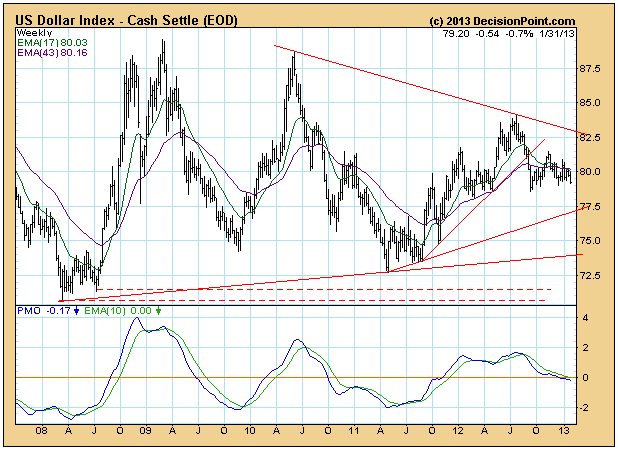
My Thursday message showed the Power Shares Dollar Index Bullish Fund (UUP) on the verge of a technical breakdown. The weekly bars in Chart 1 show the cash version of the Dollar Index... Read More
ChartWatchers February 02, 2013 at 04:50 PM
There has been quite a bit of banter recently about a "currency war" developing given the Japanese Yen has fallen dramatically against the USD - roughly -15% in the past 11-weeks... Read More
ChartWatchers February 02, 2013 at 03:41 PM
Hello Fellow ChartWatchers! The Dow moved above 14,000 yesterday at 11:04am. How do I know the exact time that happened? I know because StockCharts tweeted about it the instant it happened... Read More
ChartWatchers February 02, 2013 at 03:10 PM
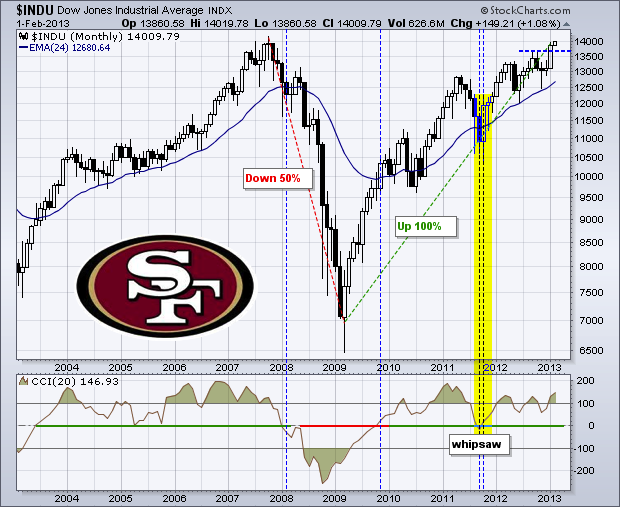
With a 150-point gain to end the week, the Dow Industrials closed above the next big number (14000) and hit a significant milestone. There is usually nothing special about round numbers, such as 14000, but this number is special because the Dow failed at 14000 in 2007... Read More