ChartWatchers October 19, 2013 at 10:42 PM
The US Congress came through at the 11th hour once again as many expected they would in opening the government and raising the debt ceiling, but only for a short while really... Read More
ChartWatchers October 19, 2013 at 10:38 PM
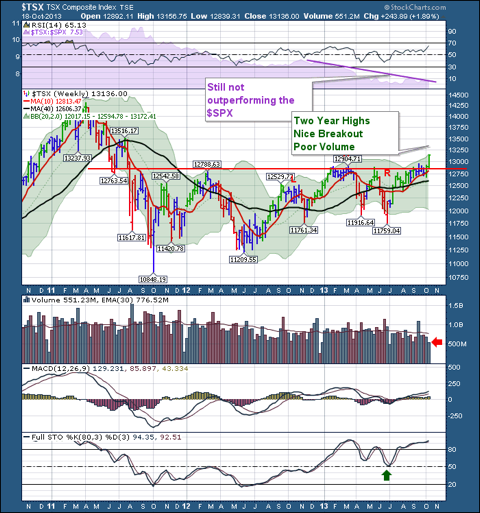
Commodity countries have been trying to find a bid for a while. This week, Toronto closed at 2 year highs, well above resistance.This is the first close above 13000 in 2 years. The link is here. $TSX Here is a chart of other major indexes breaking out... Read More
ChartWatchers October 19, 2013 at 10:28 PM
I've mentioned it before, but I'll say it again. I LOVE trading stocks (in bull markets) that gap higher on better-than-expected revenues and earnings and very strong volume as it's a sign of great management execution and investor accumulation... Read More
ChartWatchers October 19, 2013 at 05:48 AM
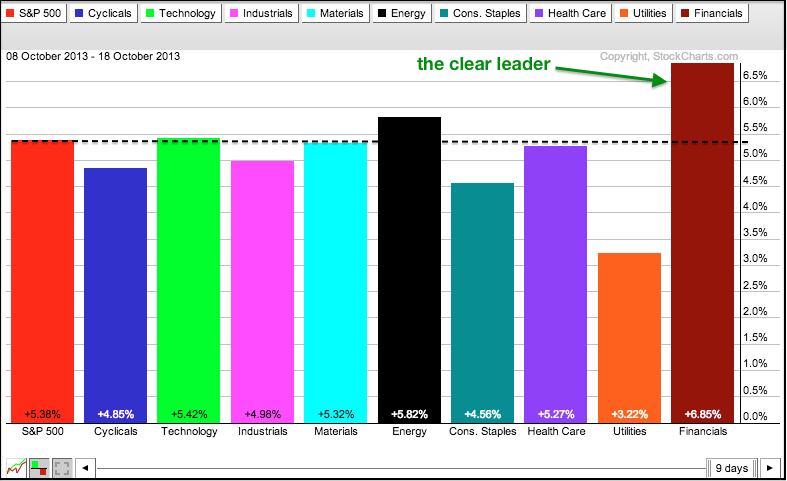
Stocks went on a tear the last two weeks with all indices and sectors moving higher. In the past week, we saw fresh 52-week highs in the Russell 2000 (small-caps), Nasdaq (techs) and the S&P 500 (broader market)... Read More
ChartWatchers October 18, 2013 at 10:01 PM
Hello Fellow ChartWatchers! Whether you realize it or not, all ChartWatchers are on a journey of self-improvement. We are all trying to become better stock market investors. As users of StockCharts, our journeys have many similar paths and common milestones... Read More
ChartWatchers October 18, 2013 at 09:34 PM
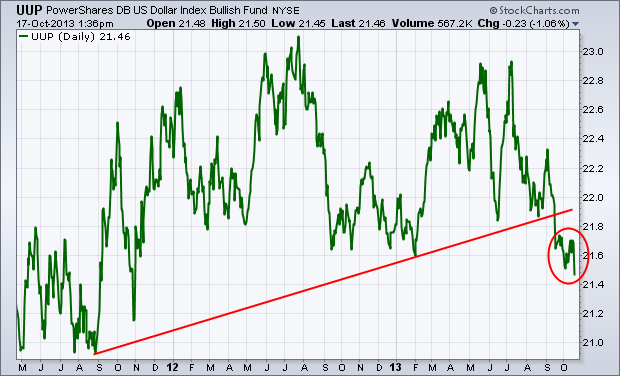
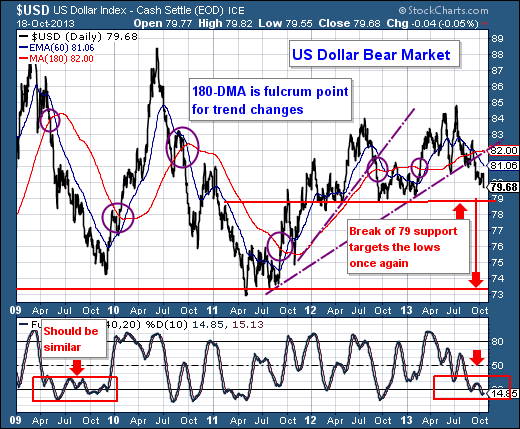
The U.S. dollar continues to weaken. Chart 1 shows the PowerShares US Dollar Bullish Fund (UUP) falling to the lowest level since the third quarter of 2011. One of the side-effects of a falling dollar is that it gives a boost to gold. And it's doing just that... Read More
ChartWatchers October 18, 2013 at 09:31 PM
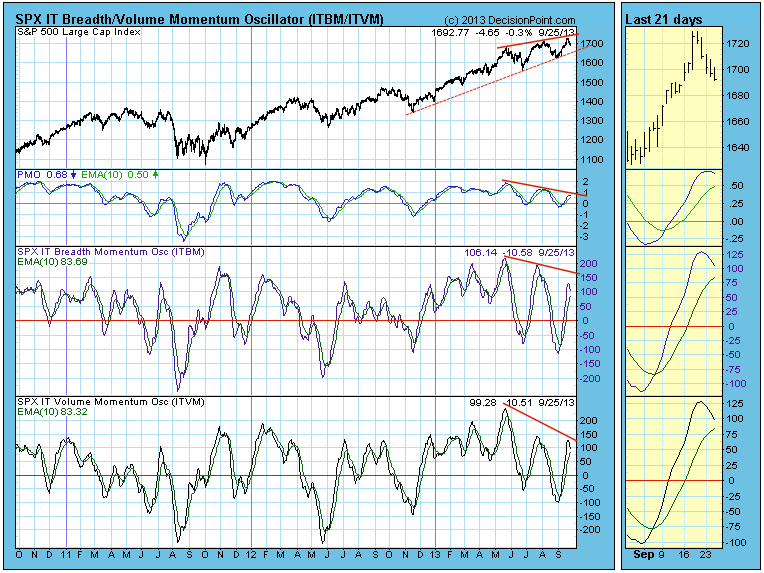
A month ago the market seemed to be setting up for an intermediate-term correction. On the month-old chart below we can see a bearish rising wedge accompanied by negative divergences in price, breadth, and volume... Read More
ChartWatchers October 06, 2013 at 02:19 PM
Hello Fellow ChartWatchers! We have several bearish-sounding articles for you this week as several of the major markets continue moving lower. The Dow has been down 9 of the past 12 trading days and its chart reflects that decline. However all is not lost... Read More
ChartWatchers October 06, 2013 at 12:45 AM
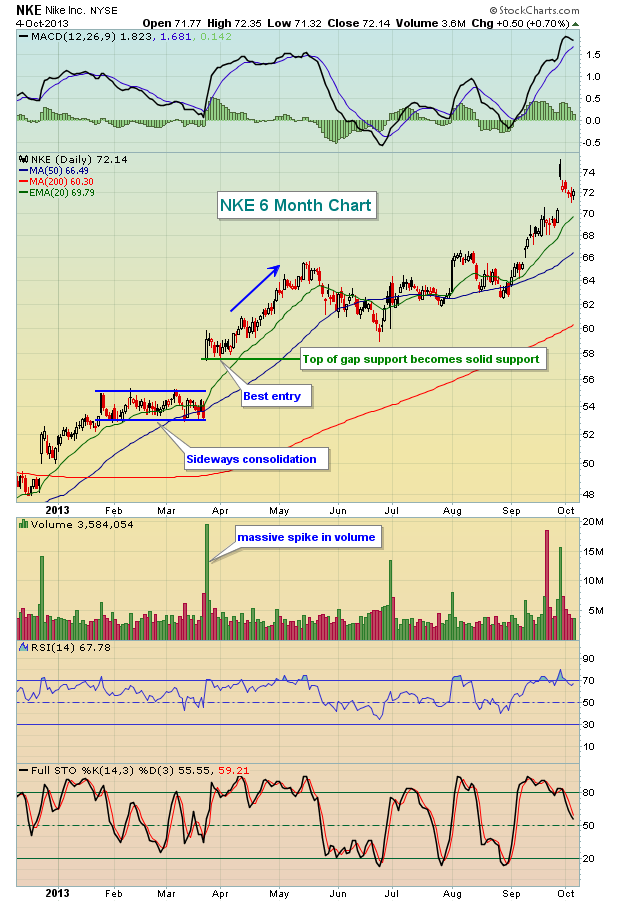
As a trader, this is my favorite time of each quarter. I love it when earnings begin to roll out because the increased volatility generally sets up excellent trading opportunities... Read More
ChartWatchers October 06, 2013 at 12:41 AM
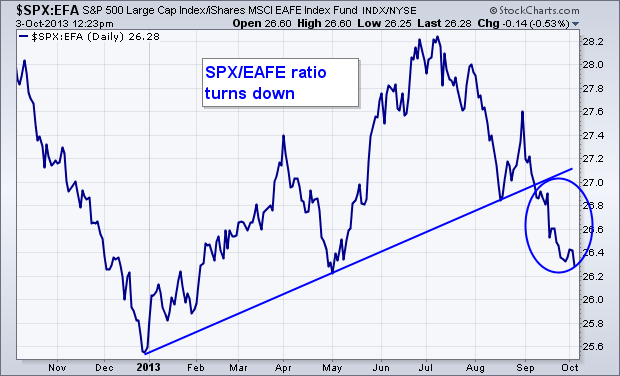
My last message discussed how money was starting to rotate out of an over-extended U.S. stock market into foreign stocks which are trying to catch up to the U.S. market. This message will build on that theme by using ratio (or relative strength analysis)... Read More
ChartWatchers October 06, 2013 at 12:31 AM

The global expansion has been tepid at best. One of the indicators I like to look at is the commodities demand. The easiest way to check that is to compare the commodities to the 10 Week MA. Here is the Commodities Dashboard I like to scan. Click here for a live version... Read More
ChartWatchers October 06, 2013 at 12:19 AM
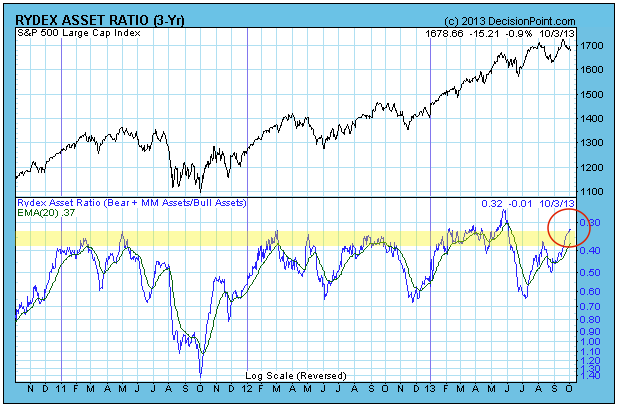
The Rydex Ratio has reached a level where it is telling us that sentiment is too bullish, and that stock prices are vulnerable. The Rydex Ratio gives a view of sentiment extremes using using the totals of assets in Rydex mutual funds... Read More
ChartWatchers October 05, 2013 at 09:32 AM
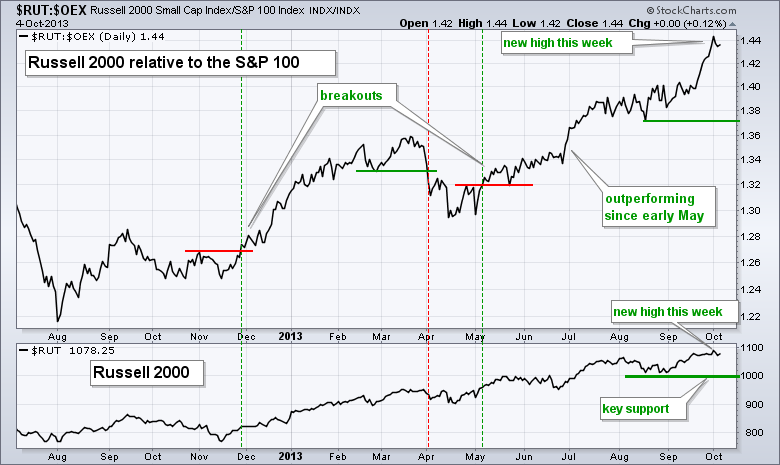
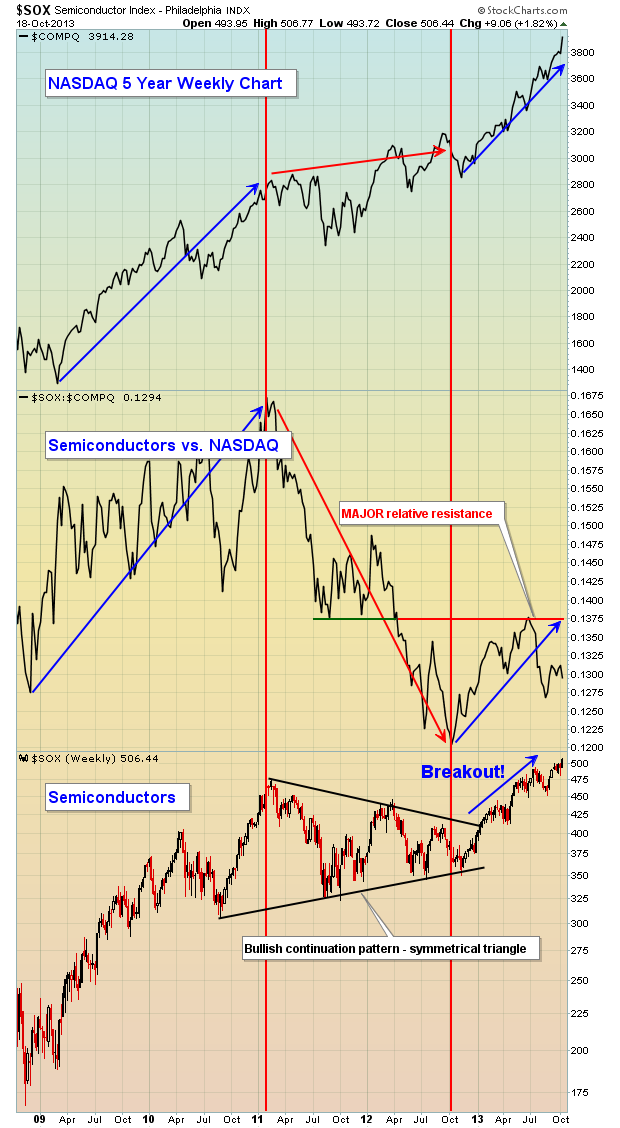
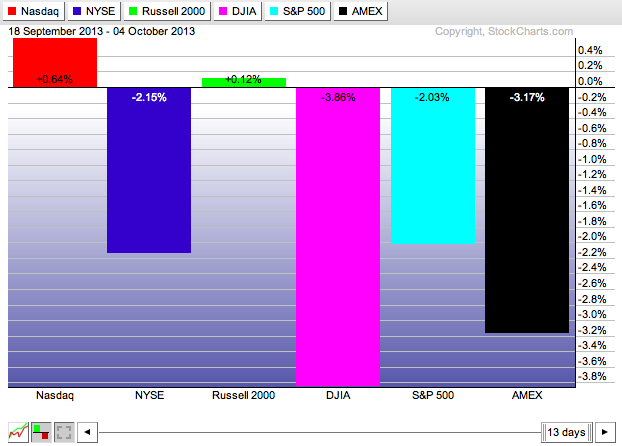
The Russell 2000 ($RUT) and the Nasdaq ($COMPQ) are leading the relative performance game and this is positive for the stock market. The Russell 2000 represents small-caps and the Nasdaq represents the technology sector... Read More