ChartWatchers May 31, 2014 at 03:23 PM
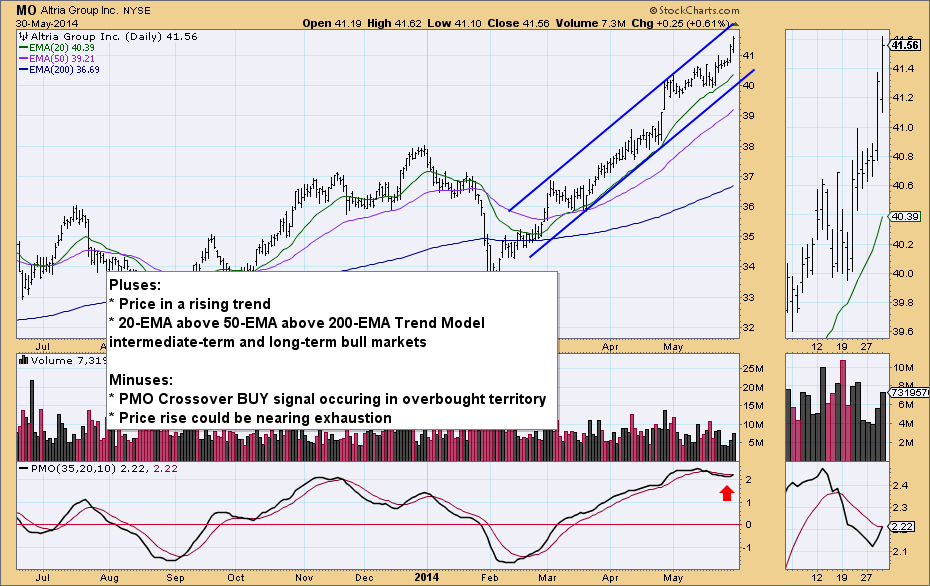
The DP Tracker reports are full of information on a variety of stocks and ETFs. Here is a link to a blog with more information on DP Trackers and how to find and use them... Read More
ChartWatchers May 31, 2014 at 01:14 PM
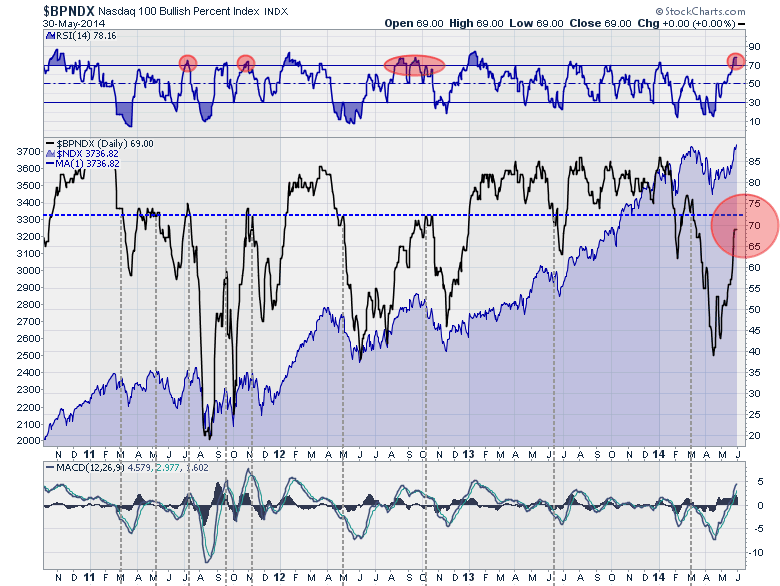
Many investors were enjoying the ride up in growth stocks through 2013 and into 2014 this year, when the whole group started dropping. This drop spilled over to the Nasdaq 100. Since early May we have bounced... Read More
ChartWatchers May 18, 2014 at 04:02 PM
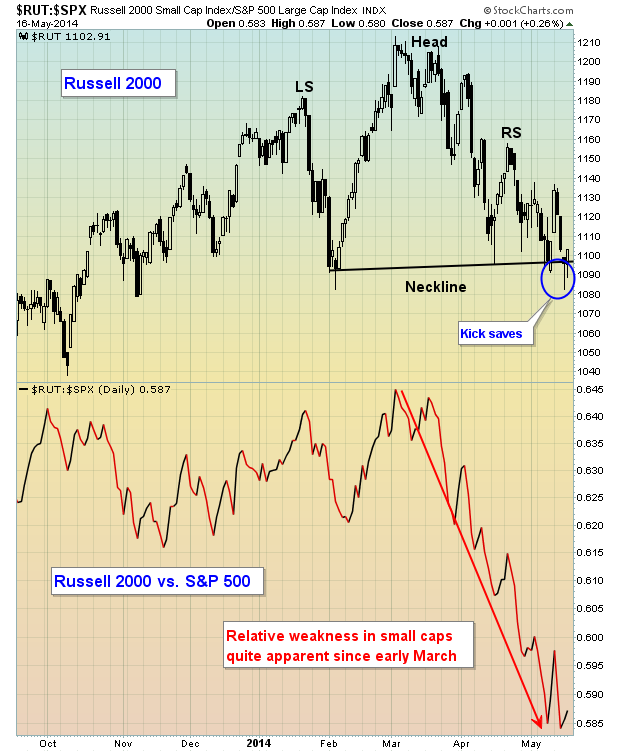
I've been very cautious about the stock market throughout most of 2014. There are warning signs galore. But the Russell 2000 has been hit particularly hard year-to-date, dropping approximately 10% from the high set in early March... Read More
ChartWatchers May 18, 2014 at 11:41 AM
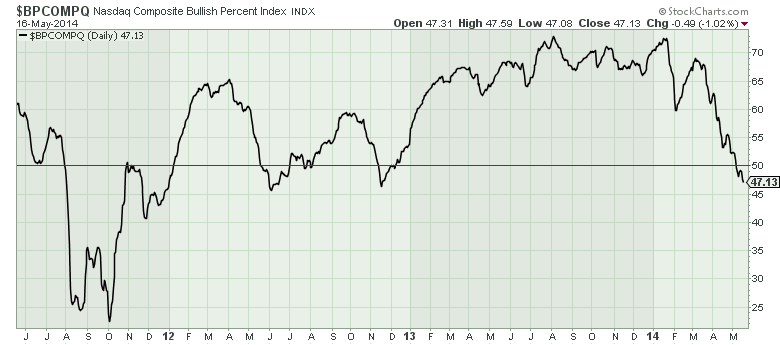
Hello Fellow ChartWatchers! While the major averages were mixed last week with the Nasdaq up 0.5% and the Dow down 0.5%, in general the markets continued to weaken... Read More
ChartWatchers May 18, 2014 at 11:38 AM
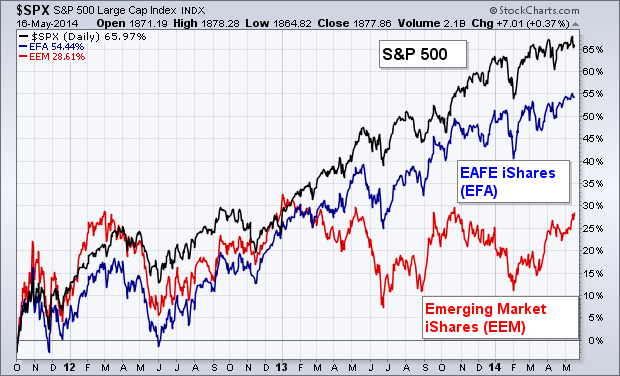
While U.S. stocks are starting to struggle on fears of high valuation, some money is starting to flow into foreign stocks that show better value. The chart below shows the S&P 500 doing better than foreign developed and emerging markets since the October 2011 bottom... Read More
ChartWatchers May 18, 2014 at 01:18 AM
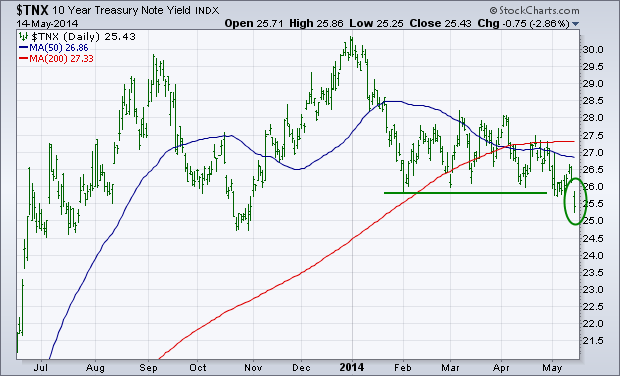
The first chart below shows the 10-Year Treasury Note Yield (TNX) falling below its early February low in trading on Wednesday. That puts the TNX at the lowest level since last October... Read More
ChartWatchers May 17, 2014 at 02:15 PM
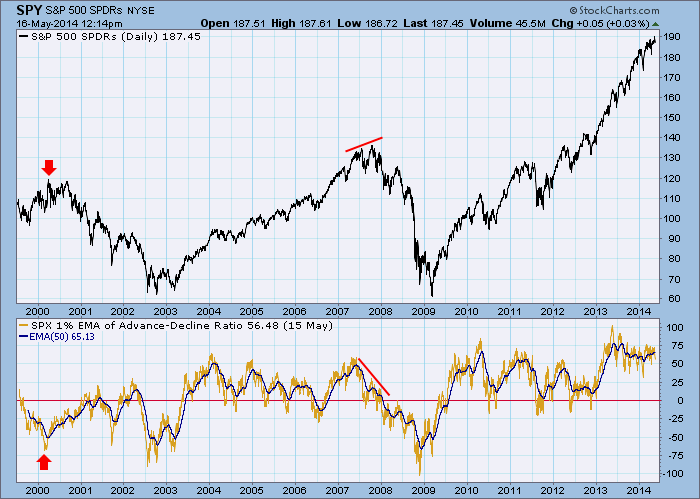
Our focus is so often on the short term, but an awareness of what is happening longer-term is essential to getting a complete sense of market condition. One useful long-term indicator is what we call the 1% EMA of the Advance-Decline Ratio... Read More
ChartWatchers May 17, 2014 at 11:55 AM
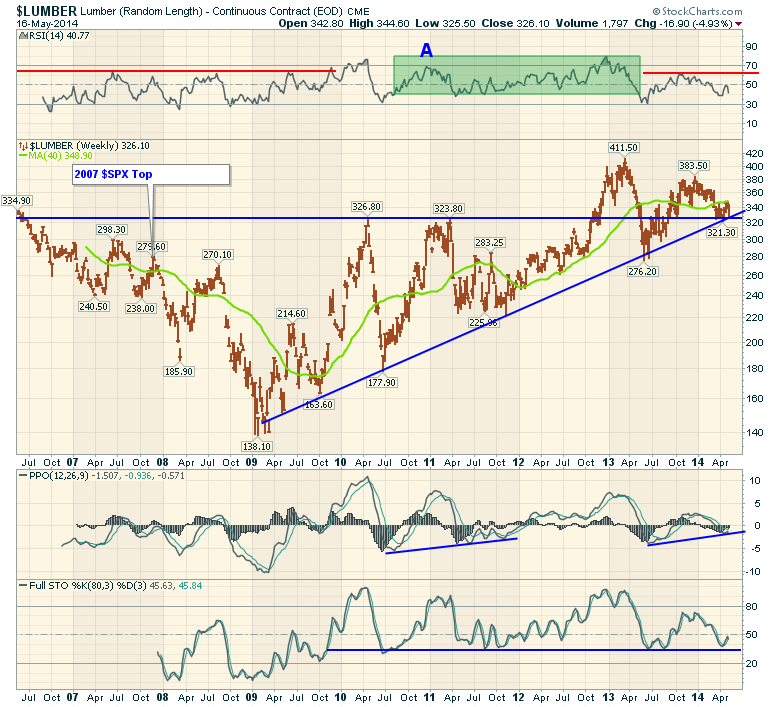
$LUMBER is a rarely watched indicator relative to $COPPER, $GOLD, and $WTIC. But Lumber is a valuable signalling tool. Let's pull up the long term chart and discuss why... Read More
ChartWatchers May 17, 2014 at 06:21 AM
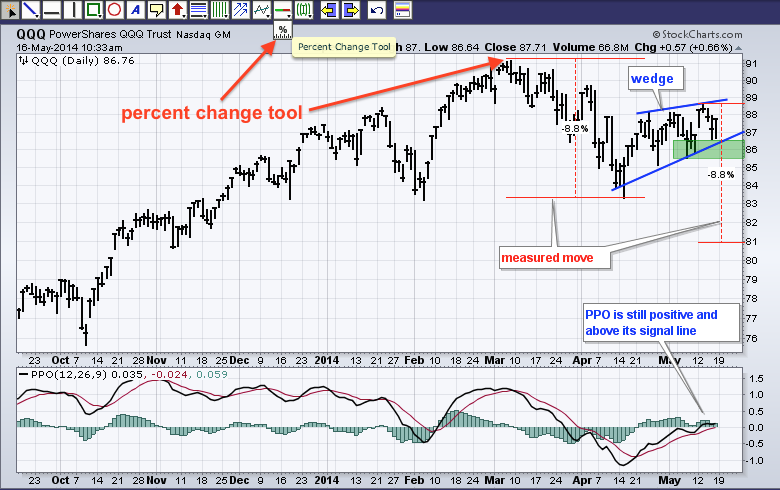
As noted in ChartWatchers two weeks ago, rising wedges are appearing on some key charts and chartists should watch these closely for directional clues... Read More
ChartWatchers May 03, 2014 at 05:41 PM
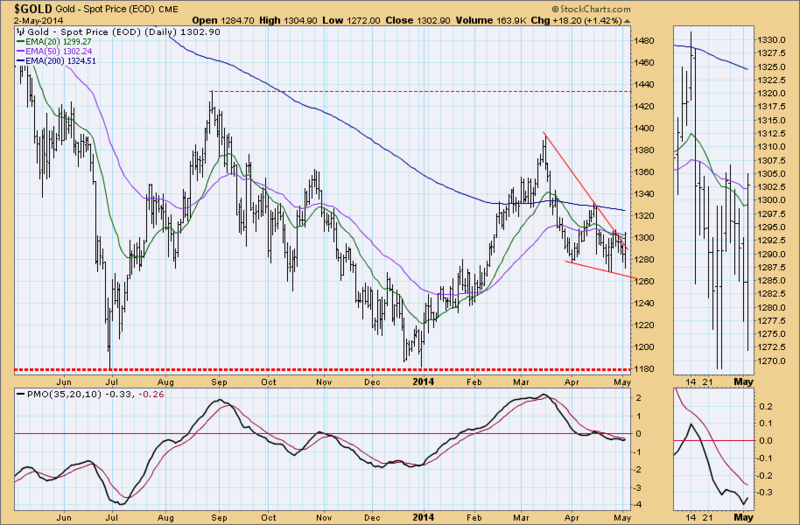
Gold broke out of its recent falling wedge pattern, which is the normal expectation for that pattern. The weekly chart shows price sliding down the declining tops line. Nice that it is staying on top of the line, but it needs to reverse direction... Read More
ChartWatchers May 03, 2014 at 05:29 PM
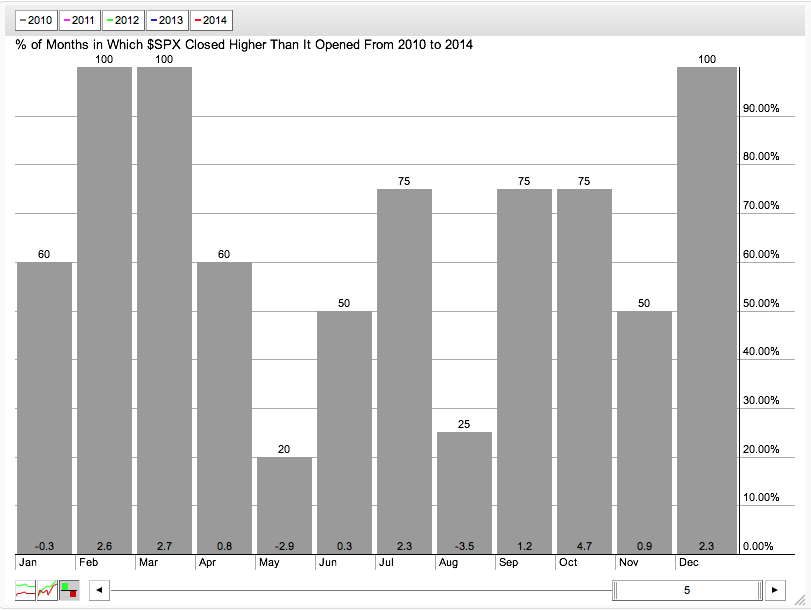
Hello Fellow ChartWathcers! April ended on a fairly positive note with all of the major US average up about 1% for the week. That comes as we head into what has been - at least over the last 5 years - the worst month of the year for the S&P 500... Read More
ChartWatchers May 03, 2014 at 05:08 PM
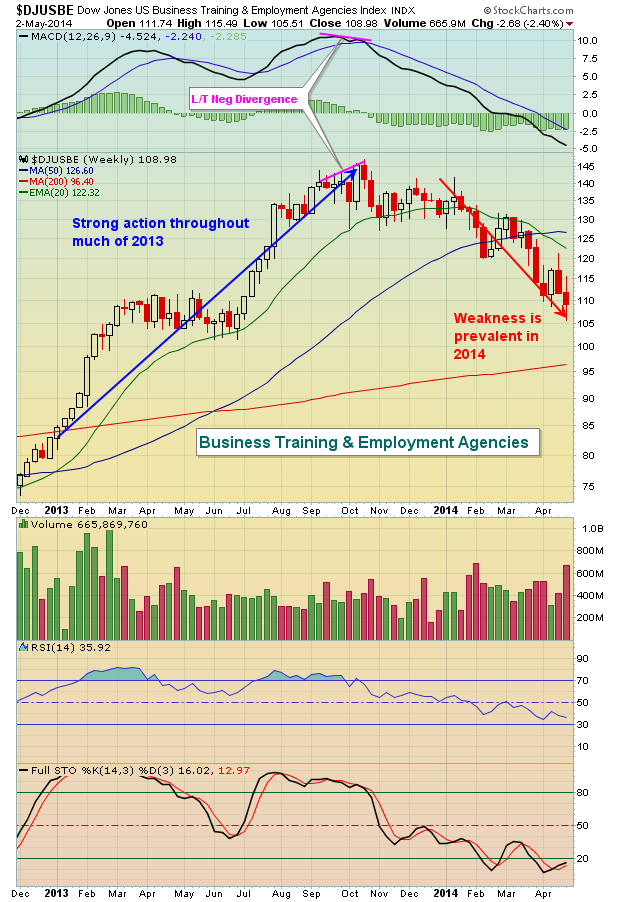
In 2013, market participants couldn't get enough of cyclicals, or consumer discretionary stocks. The XLY (ETF that tracks consumer discretionary) rose more than 40% in 2013 to lead all sectors on a relative basis... Read More
ChartWatchers May 03, 2014 at 03:23 PM
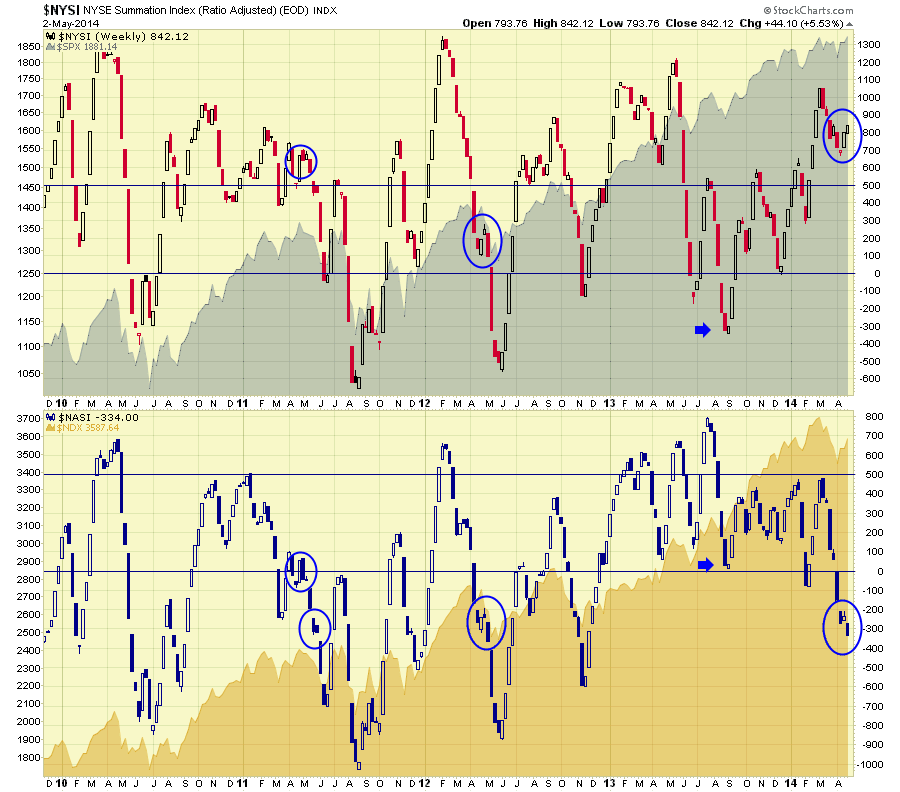
The summation indexes built by Sherman and Marian McClellan are almost paradoxical this week. The $NYSI and the $NASI usually track similarly. Which one will be right? Here is the chart... Read More
ChartWatchers May 03, 2014 at 11:21 AM
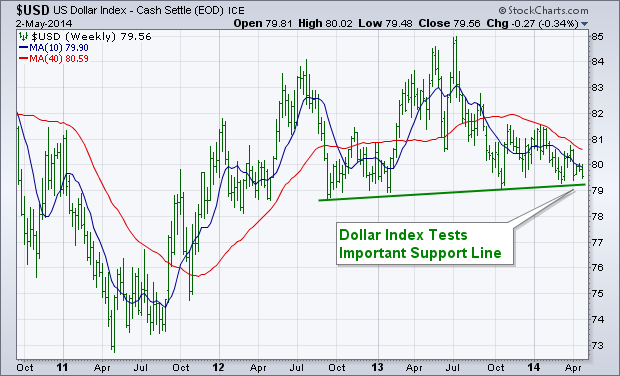
The dollar has been weakening since the start of the year, and is now in the process of testing some important chart support. The weekly bars in the chart below show the U.S. Dollar Index ($USD) testing a support line drawn under 2012-2013 lows... Read More
ChartWatchers May 03, 2014 at 04:15 AM
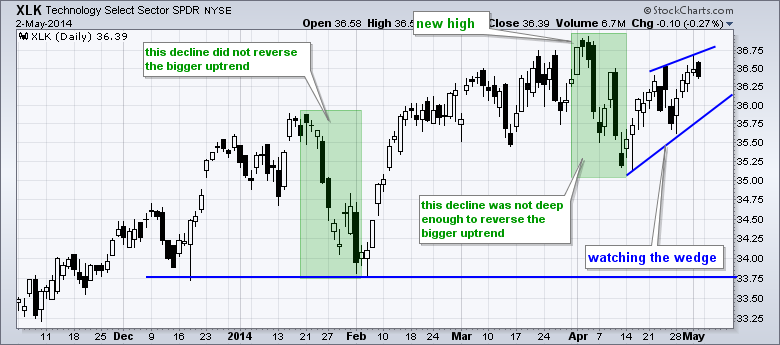
The Technology SPDR (XLK) and the Finance SPDR (XLF) remain in uptrends overall, but Friday's intraday reversal could signal a near term peak and result in a bearish wedge. The first chart shows XLK hitting a new high in early April and then declining below 35... Read More