ChartWatchers August 15, 2015 at 10:24 PM
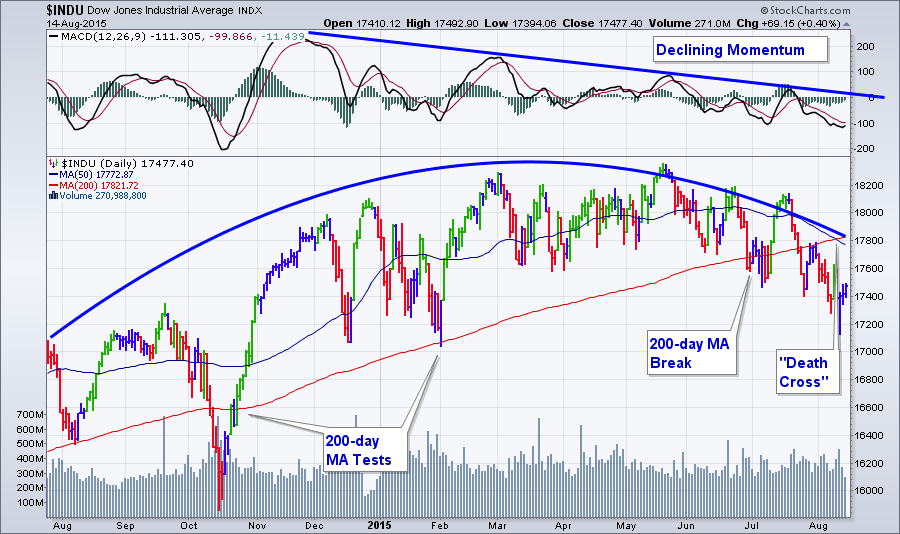
Hello Fellow ChartWatchers! The US markets continue to s-l-o-w-l-y roll over with the Dow Industrials leading the way. Despite the fact that $INDU moved 100 points higher this week, the intermediate to long-term trend is clearly down... Read More
ChartWatchers August 15, 2015 at 03:11 PM
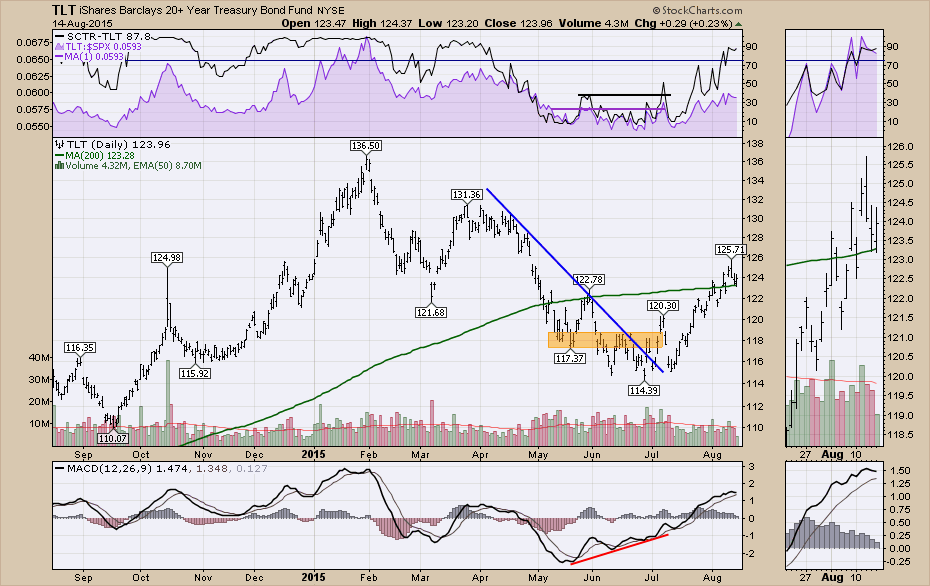
A few weeks ago on the July 16th webinar, I talked about the bond markets and the chart view was looking bullish to get long TLT. Well, that actually played out nicely. But now the MACD looks like it wants to roll over. The SCTR has just pushed above 75... Read More
ChartWatchers August 15, 2015 at 12:13 PM
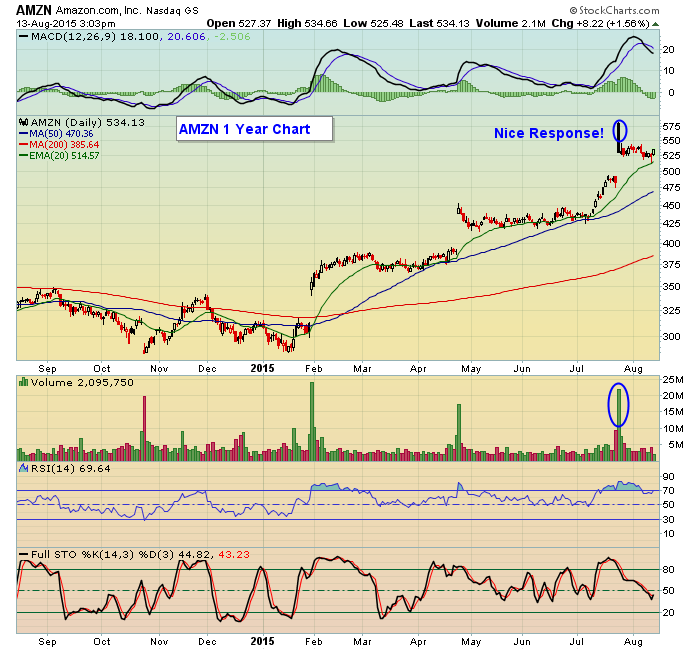
There are differing opinions on whether or not it makes sense to hold stocks into earnings reports. One camp argues that you stand to make a big score if a company beats its numbers... Read More
ChartWatchers August 15, 2015 at 10:53 AM
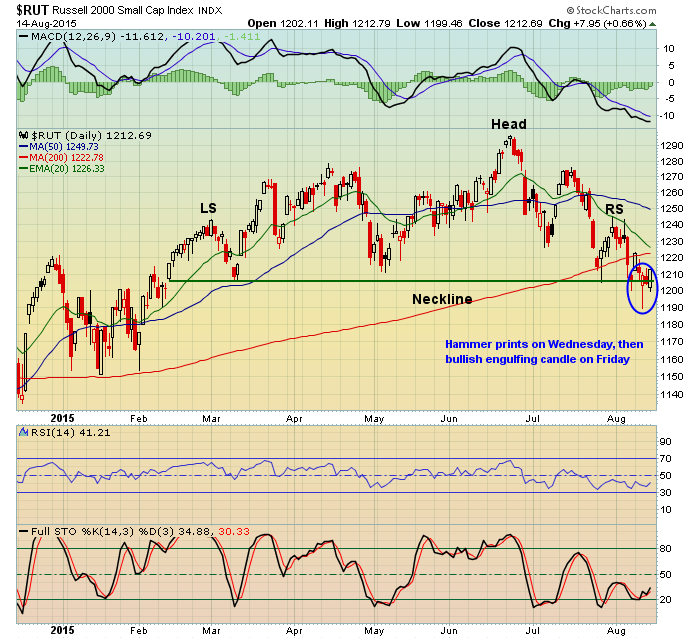
Bears are awaiting price breakdowns in key areas of the market, but thus far they remain highly disappointed. Last week they had their chance to take down the small cap universe on two fronts and both failed... Read More
ChartWatchers August 15, 2015 at 03:57 AM
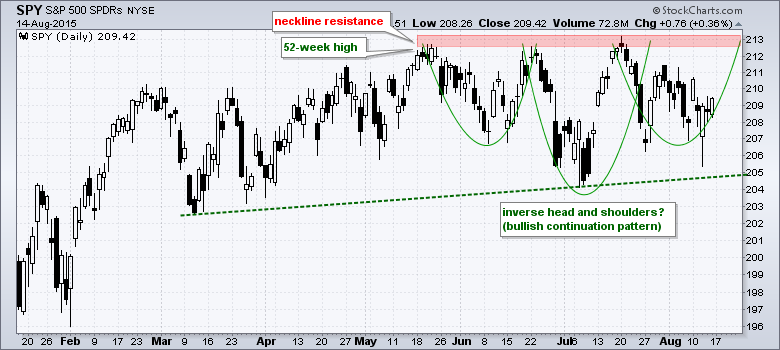
The S&P 500 SPDR remains largely range-bound since March, but a pair of potentially bullish patterns emerged and signs of accumulation are appearing. First, note that SPY hit new 52-week highs in May and July, and the overall trend is still up... Read More
ChartWatchers August 14, 2015 at 08:36 PM

There are many sources that DecisionPoint uses to develop the DP Sentiment charts. You'll find two of them in the free DecisionPoint Gallery: American Association of Individual Investors (AAII) Sentiment and Rydex Asset Ratio... Read More
ChartWatchers August 02, 2015 at 11:15 AM
Hello Fellow ChartWatchers! It was a fairly positive week for the markets last week following a big down move during the week before. For the month of July, the Nasdaq was the big winner rising 2.3% and the Russell 2000 was the loser falling 1.4%... Read More
ChartWatchers August 01, 2015 at 06:16 PM
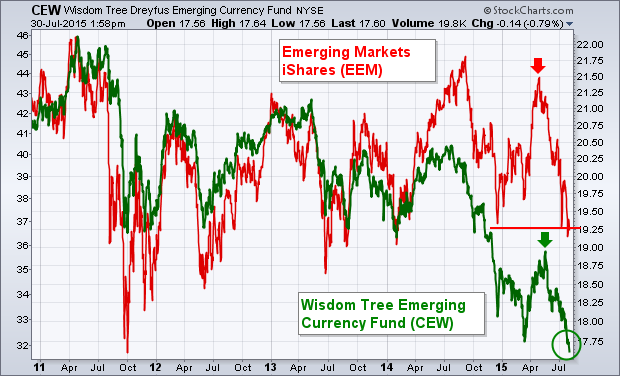
Emerging market assets are suffering from the dual threat of rising U.S. interest rates and a stronger dollar. The most direct result is seen in EM currencies. The green line in Chart 9 shows the Wisdom Tree Emerging Currency Fund (CEW) falling to the lowest level in five years... Read More
ChartWatchers August 01, 2015 at 05:59 PM
We are deep into earnings season at this point. There have been enough companies reporting so far to make an assessment of what the market thinks of the overall earnings picture as July comes to an end... Read More
ChartWatchers August 01, 2015 at 04:52 PM
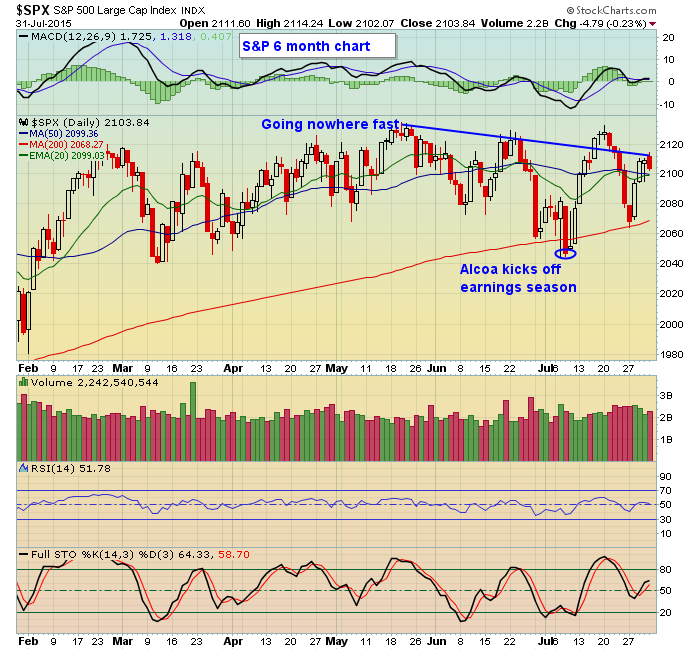
I don't think so. I'm always a bit leery of August and September because of the historical tendency for the stock market to struggle during the late summer season. Throughout the current 6+ year bull market, the Aug-Sept period has racked up gains four out of six times... Read More
ChartWatchers August 01, 2015 at 10:29 AM
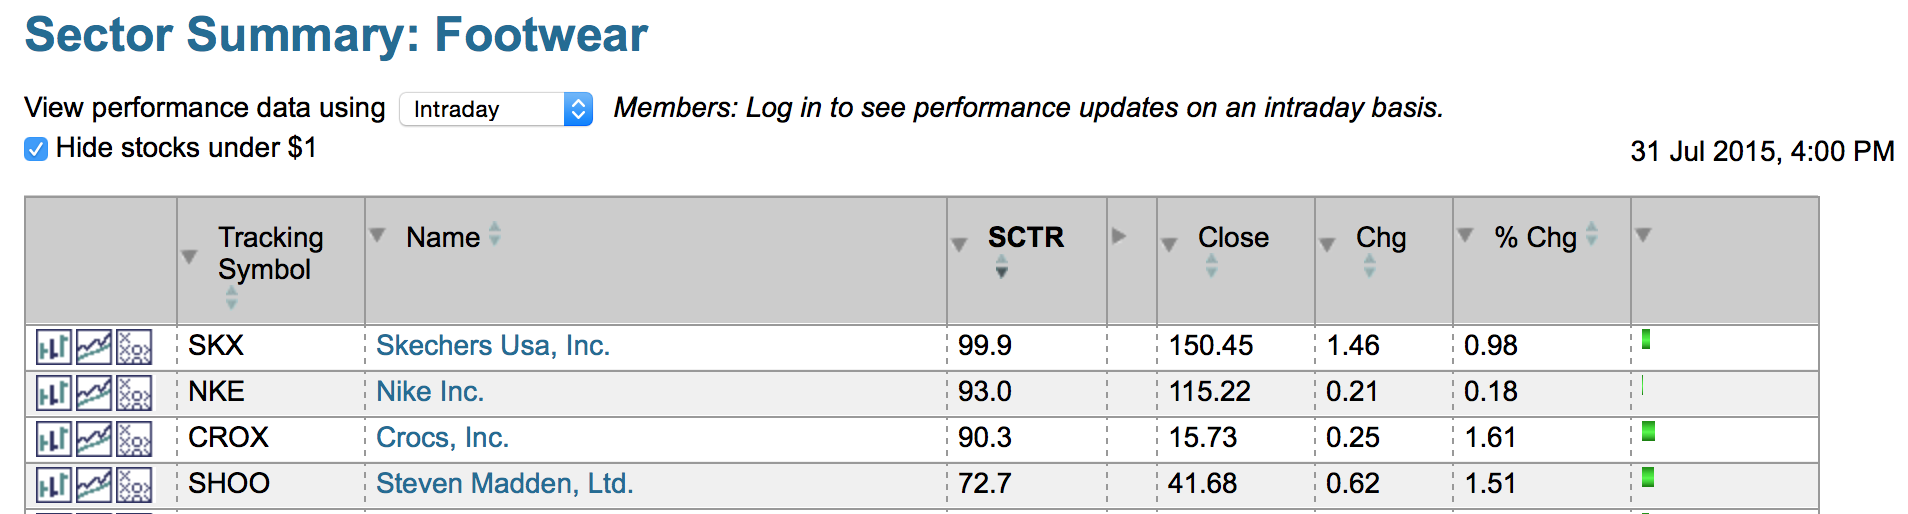
This time of year is on my calendar to start hunting the best in retail for Christmas. Everyone following momentum has seen the Consumer Cyclicals ETF (XLY) continue to be a top performer... Read More
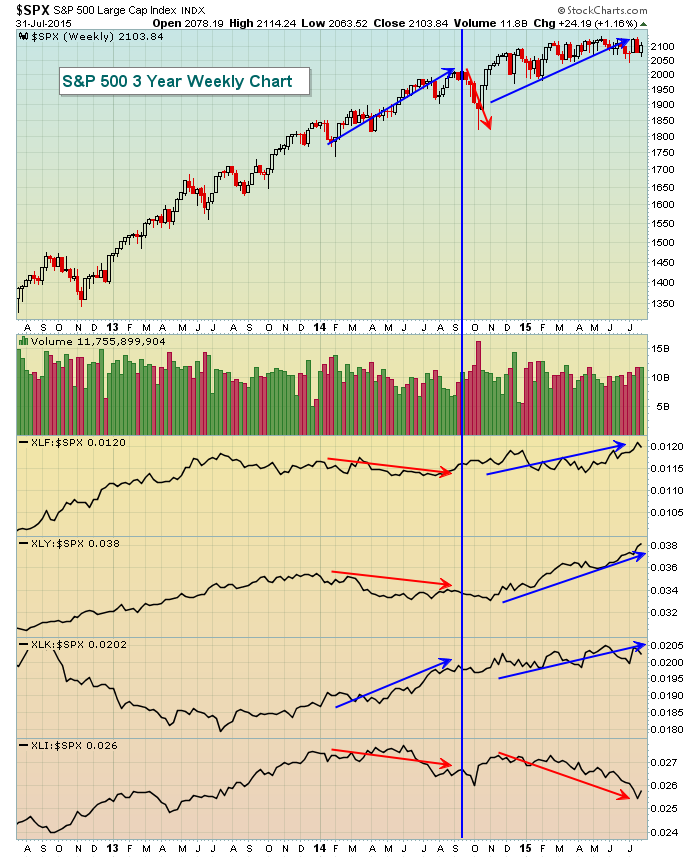
ChartWatchers August 01, 2015 at 03:10 AM
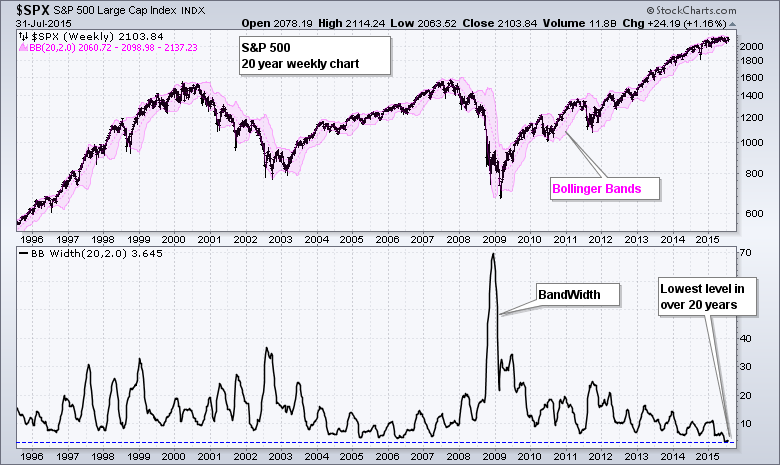
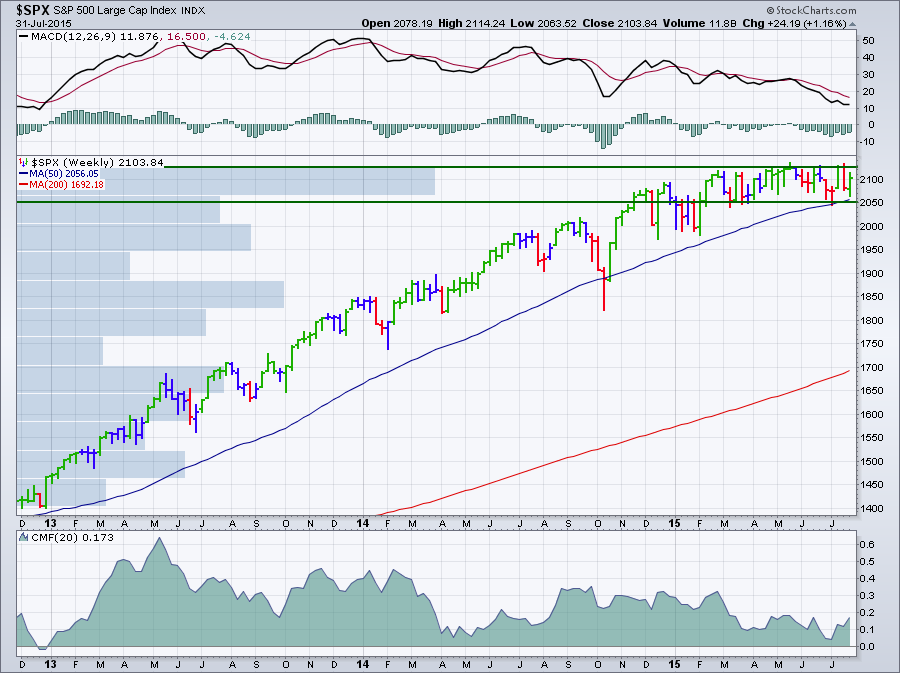
The S&P 500 is locked in a 100 point trading range (2040-2140) since March because of a serious split in sector performance. At less than 5% this is the narrowest range in several years. Note that Bollinger Bandwidth on the weekly chart reached a 20+ year low in July... Read More