ChartWatchers April 15, 2017 at 03:33 PM
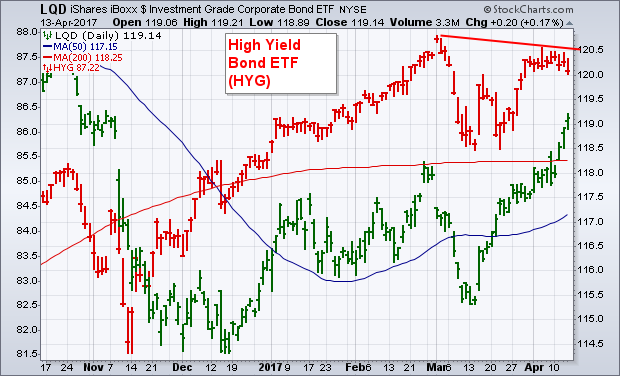
The green bars in the chart below show the iBoxx Investment Grade Corporate Bond iShares (LQD) trading at a new five-month high after clearing its 200-day average. The red bars, however, show the iBoxx High Yield Corporate Bond iShares (HYG) backing off from its early March high... Read More
ChartWatchers April 15, 2017 at 10:03 AM
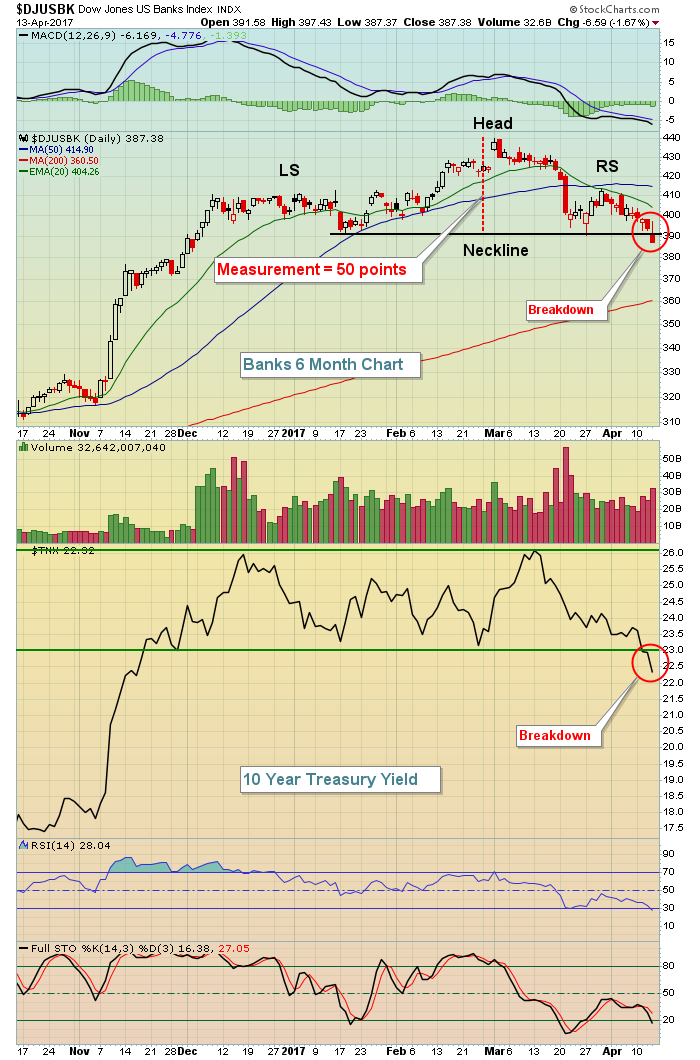
At the time of the last ChartWatchers article, I didn't really see a whole lot to be nervous about. However, the bullish picture certainly is getting a bit murkier based on developments since then... Read More
ChartWatchers April 14, 2017 at 05:39 PM
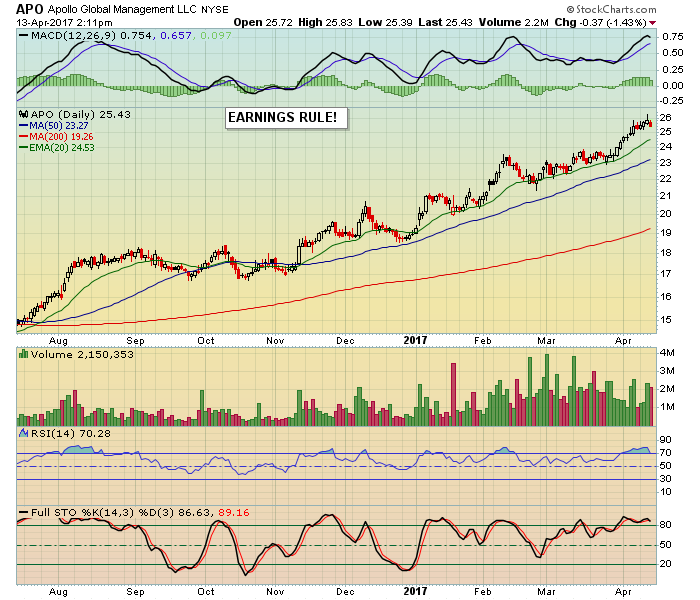
It's that time of the year, a time when all attention is turned to the bottom line of corporate America. It happens every quarter and it always has a major impact on the direction of the market. And the bottom line almost always trumps everything else... Read More
ChartWatchers April 14, 2017 at 02:55 PM

Most of us are aware of the tracking error between oil and the US Oil Fund. There is indeed a tracking error, but a few charts reveal that this tracking error is subject to fluctuations and can even remain stable for extended periods... Read More
ChartWatchers April 14, 2017 at 01:00 PM
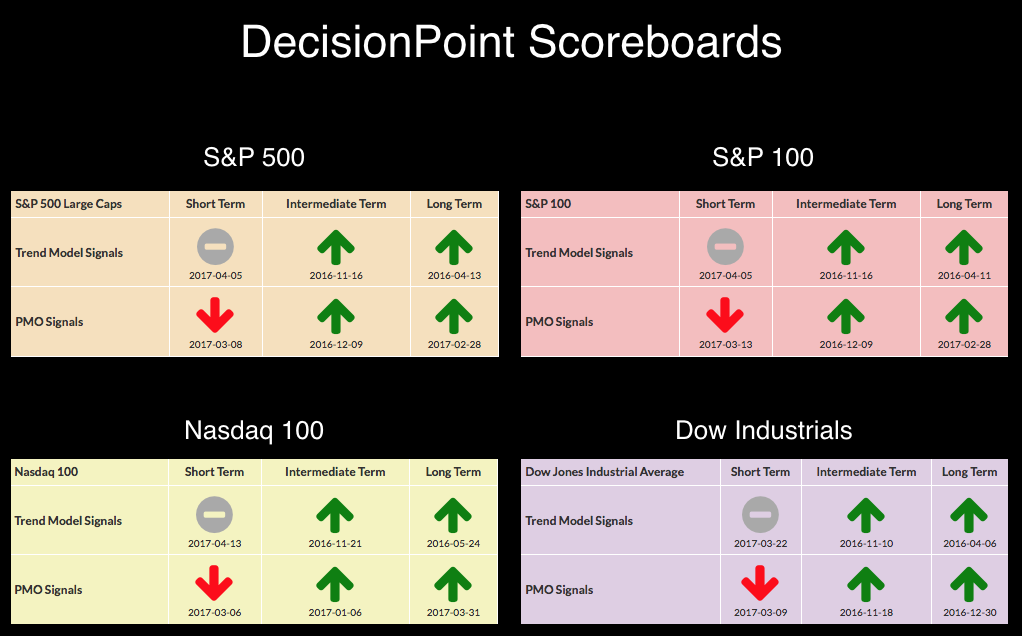
One look at the DP Scoreboards and it is apparent there are problems in the short term. It appears that the intermediate term is sitting comfortably on BUY signals... Read More
ChartWatchers April 13, 2017 at 11:15 PM
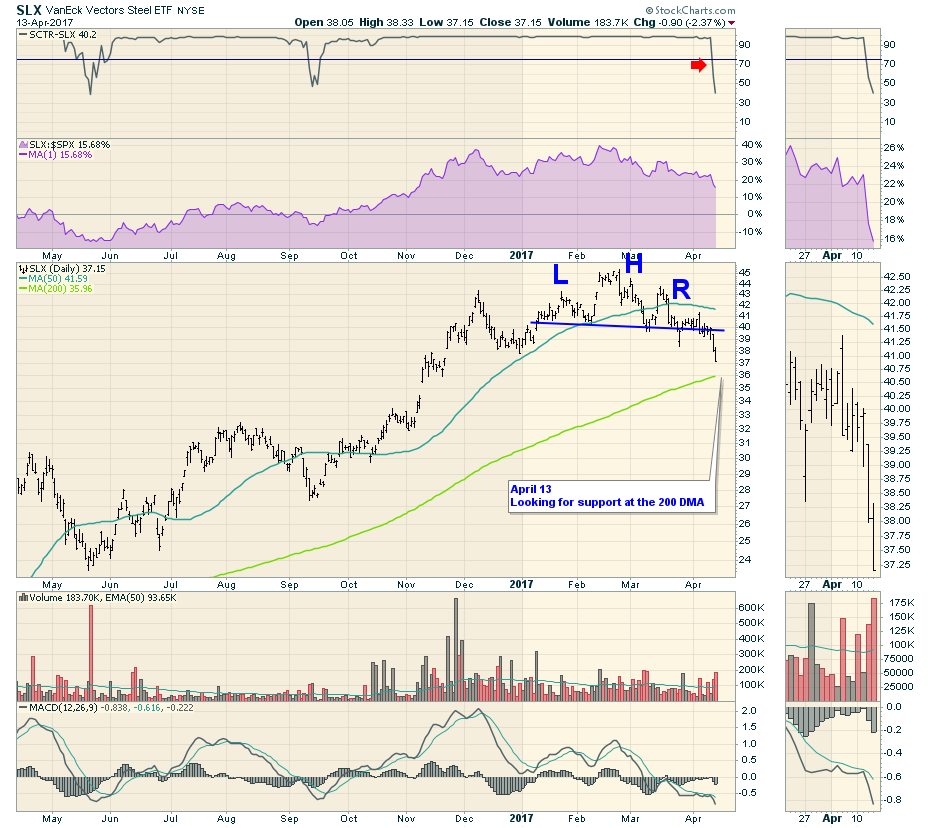
The Industrial Metals have been on everyone's radar recently. The daily and weekly charts are showing big cracks. Starting with the Steel ETF (SLX), this is on a train out of town. This contains a list of companies related to the Steel industry... Read More
ChartWatchers April 01, 2017 at 05:43 PM
Many market pundits on CNBC continue to predict a market top, discussing how we've run too far too fast and that valuations are too high and blah, blah, blah. Fear sells and CNBC is all about their ratings and advertisements... Read More
ChartWatchers April 01, 2017 at 05:33 PM
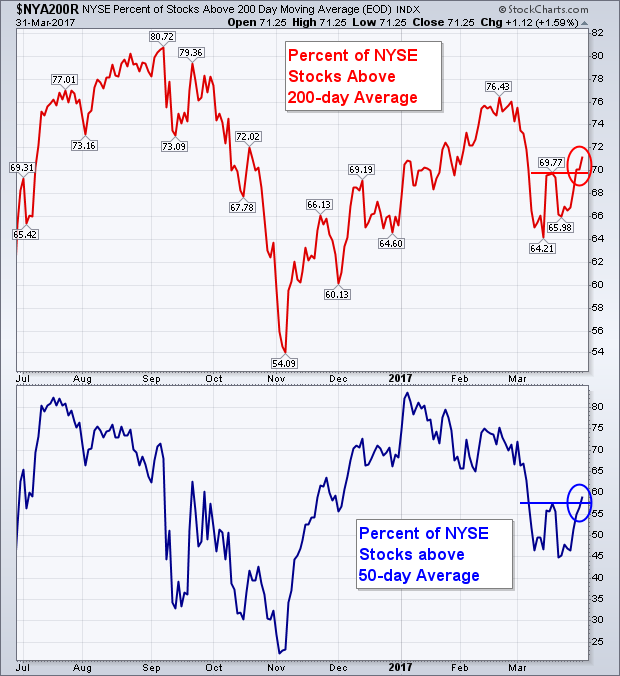
My last two messages have stressed the importance of the 200-day moving average. It's what separates uptrends from downtrends. In order to sustain a bull market, more stocks have be above their 200-day average than below it. And that is currently the case... Read More
ChartWatchers April 01, 2017 at 05:19 PM
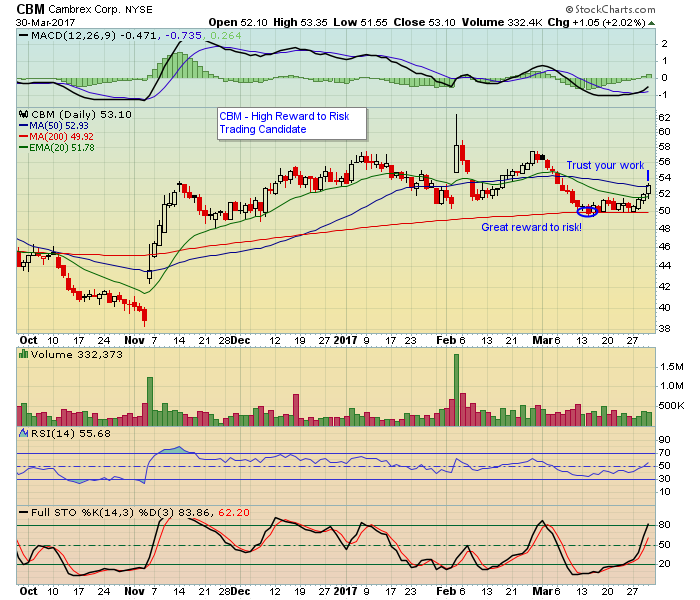
If you trade stocks you're going to run into situations where you question whether or not you are making good decisions. This could include identifying entry levels and setting price targets and stop losses... Read More
ChartWatchers April 01, 2017 at 12:47 PM
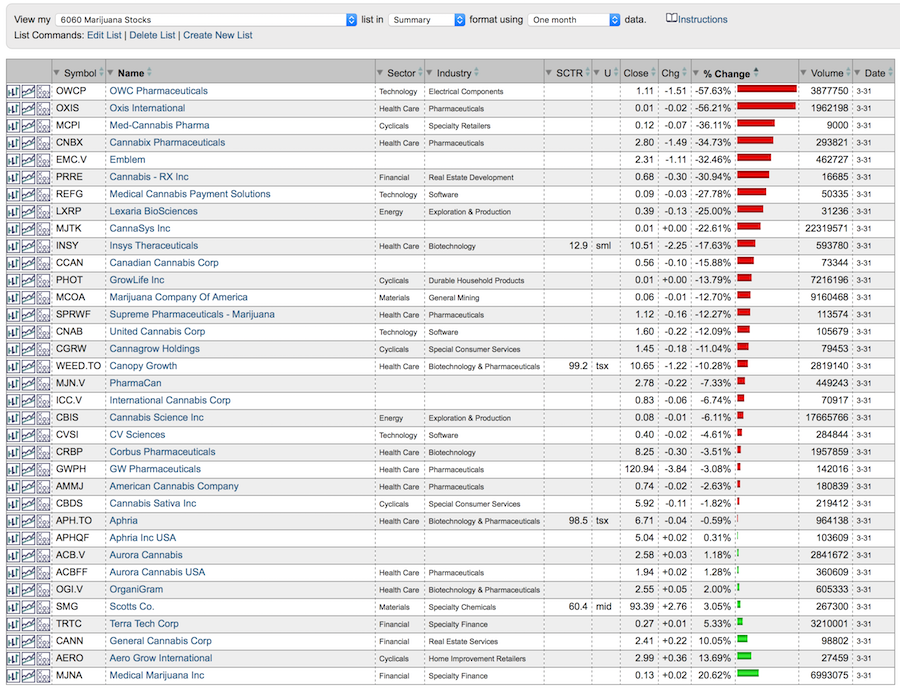
The Stock Market is a real-time place to see the true spirit of Greed and Fear come to the forefront. Technicians use the words Supply and Demand to study the market characteristics... Read More
ChartWatchers March 31, 2017 at 10:24 PM
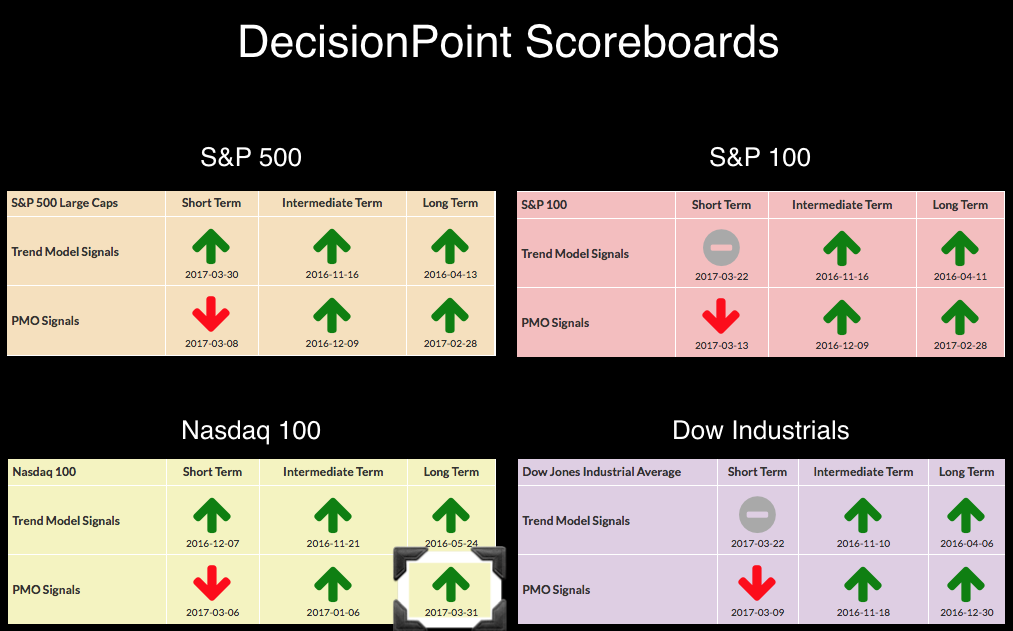
Patience was rewarded today as the Long-Term Price Momentum Oscillator (PMO) confirmed a BUY signal that had been pending most of the month. We don't log new monthly PMO signals until the chart goes "final" on the last trading day of the month... Read More