ChartWatchers October 21, 2017 at 09:39 AM
There are different ways to view best seasonal stocks depending on whether you're interested solely in average returns for a particular month or time period or if you're interested in the percentage times that a security rises for a particular month or time period... Read More
ChartWatchers October 21, 2017 at 06:44 AM
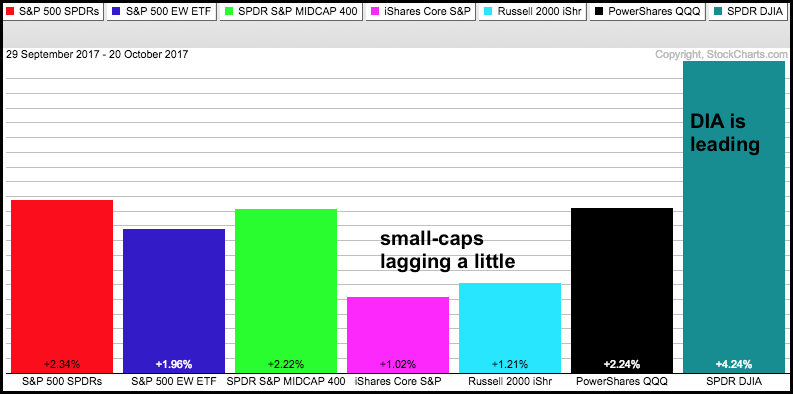
The EW S&P 500 ETF, S&P MidCap SPDR and S&P 500 SPDR moved to new highs this week, but the S&P SmallCap iShares and Russell 2000 iShares are lagging and remain below their early October highs, which were 52-week highs... Read More
ChartWatchers October 20, 2017 at 07:06 PM
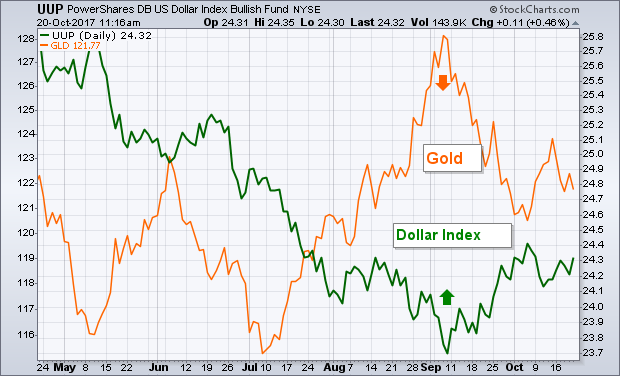
The fact that U.S. rates are rising faster than elsewhere on the globe is boosting the dollar. A rising dollar usually hurts the price of gold. And it is... Read More
ChartWatchers October 20, 2017 at 07:00 PM
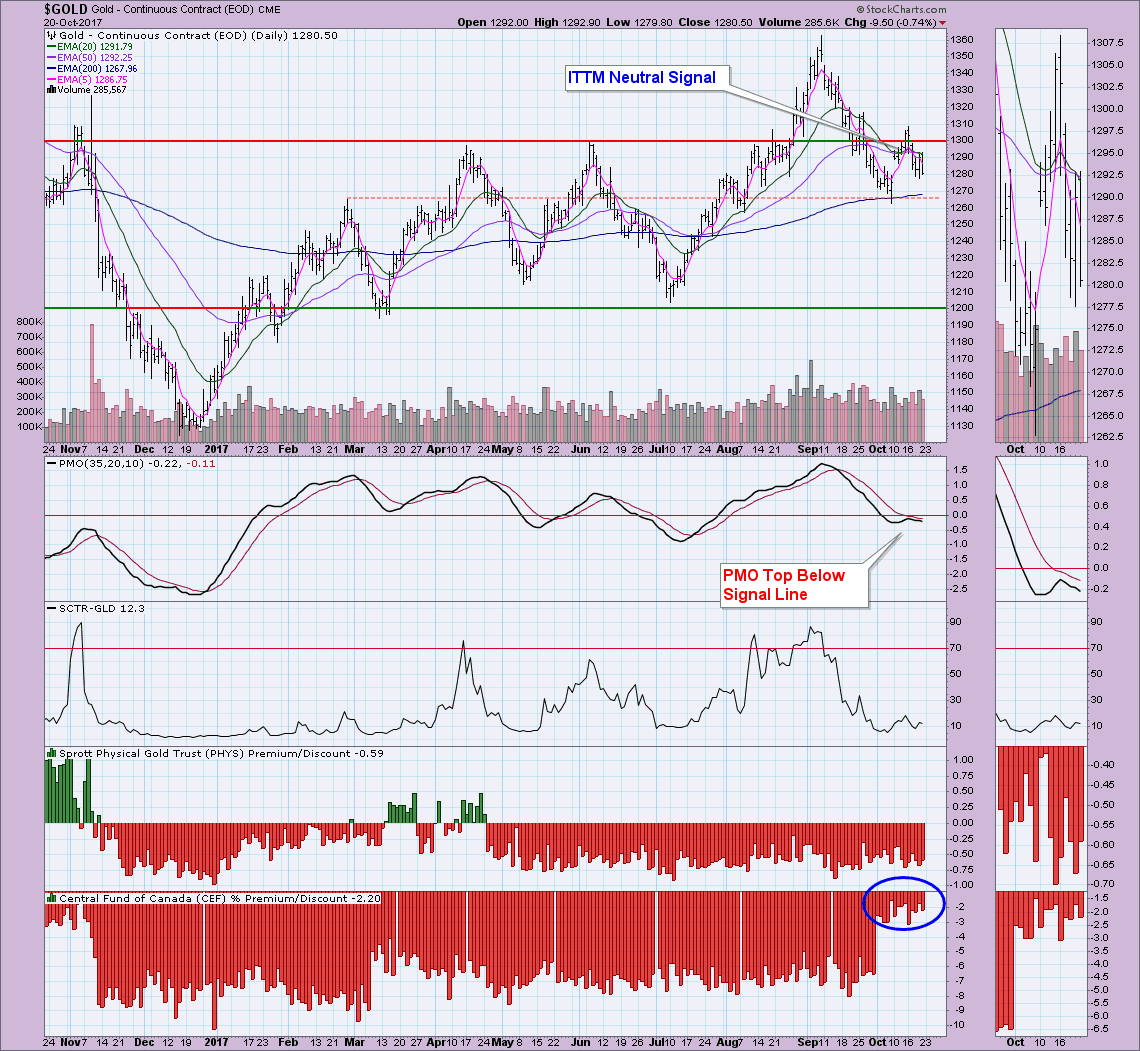
I recently wrote about Gold in the DecisionPoint blog. We saw the 20-EMA pull out of its decline to keep its ITTM BUY signal. However, the gravitational pull of price after it couldn't hold support at 1300 was too much and the 20-EMA finished just below the 50-EMA today... Read More
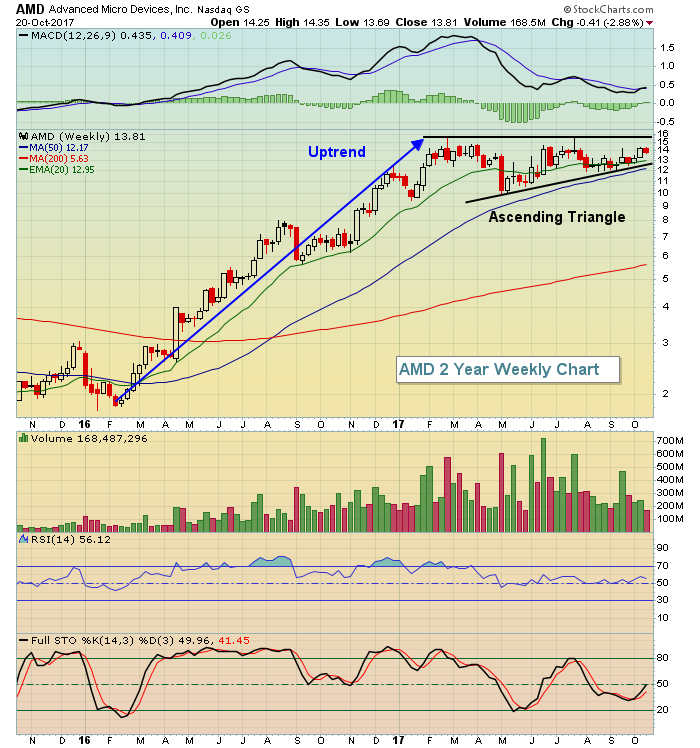
ChartWatchers October 20, 2017 at 04:27 PM
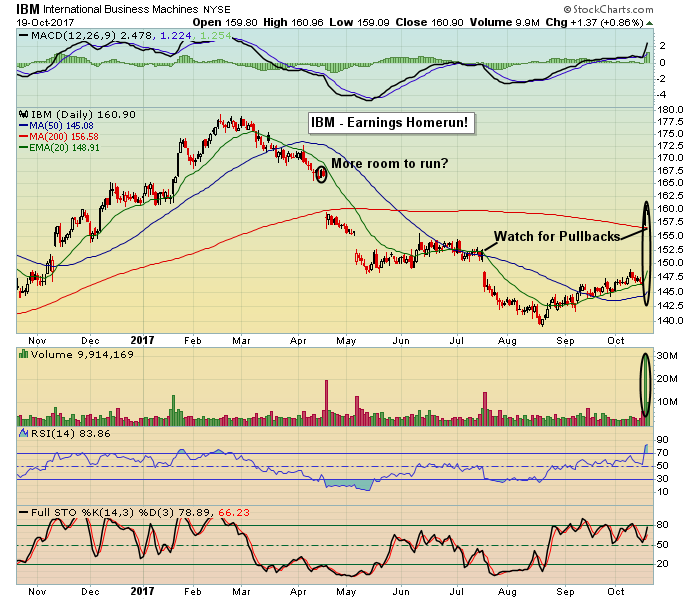
Earnings season is in full swing now and so far so good. How do I know this? All you have to do is look at the overall market reaction. And it doesn't hurt when a giant tech company left for dead knocks it out of the park... Read More
ChartWatchers October 07, 2017 at 01:28 PM
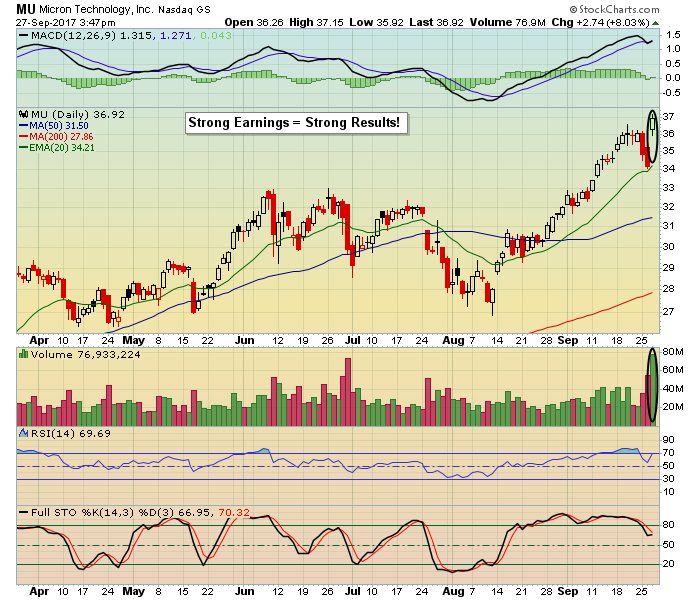
They say how time flies; and it's true, especially from one earnings season to another, and starting this week we're going to start hearing from thousands of companies as they release their numbers... Read More
ChartWatchers October 07, 2017 at 01:17 PM
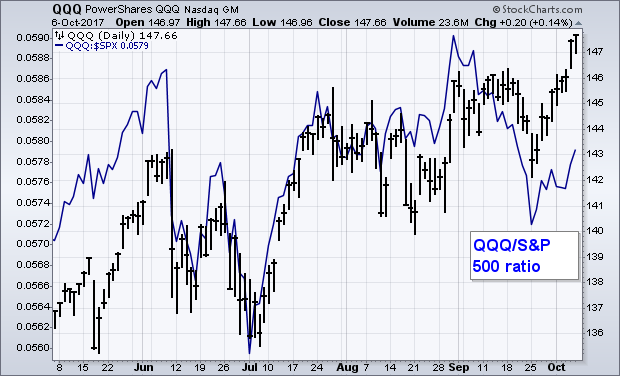
Chart 1 shows the Powershares QQQ ETF hitting a record high this week. It was the last of the major stock indexes to do so, and its breakout is a positive sign for the market. It also did slightly better than the rest of the market... Read More
ChartWatchers October 07, 2017 at 11:02 AM
I've been following the stock market for a long time and I'm always searching for that perfect signal that never fails... Read More
ChartWatchers October 07, 2017 at 09:31 AM
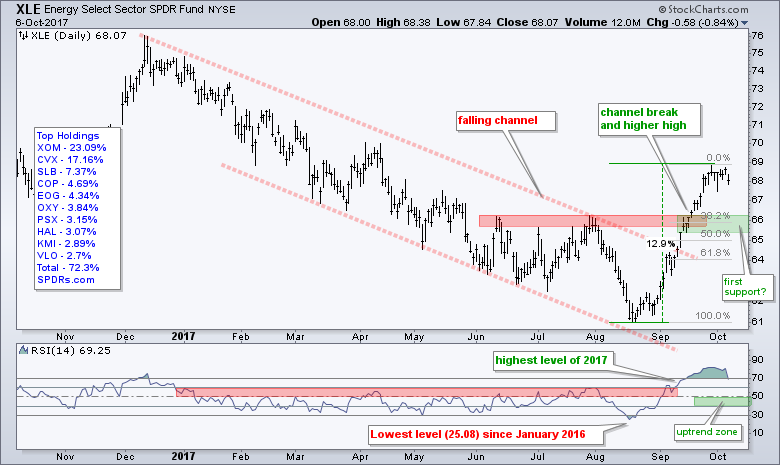
The Energy SPDR (XLE) is the top performing sector SPDR since mid August with a double digit advance over the last seven weeks. On the price chart, XLE broke out of the channel, exceeded its summer highs and pushed RSI above 70 for the first time this year... Read More
ChartWatchers October 06, 2017 at 06:53 PM
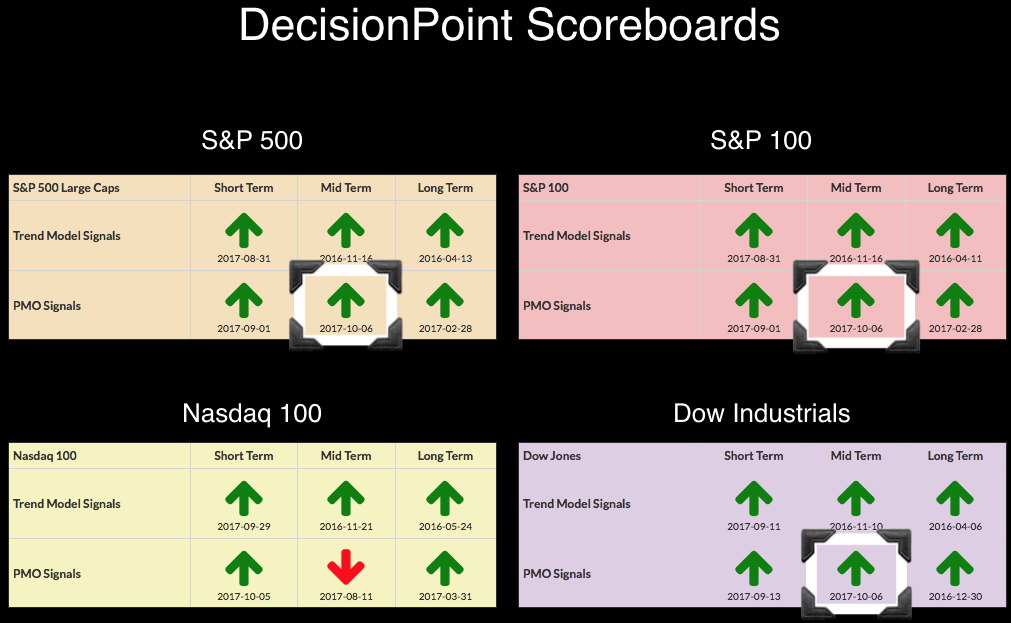
Today all but the NDX garnered new PMO BUY signals in the intermediate term. The intermediate-term PMO signals are gathered from the weekly chart PMOs and their crossovers. I'll give you a peek at the NDX weekly chart too, but it is much further away from a new weekly BUY signal... Read More
ChartWatchers October 06, 2017 at 04:35 PM
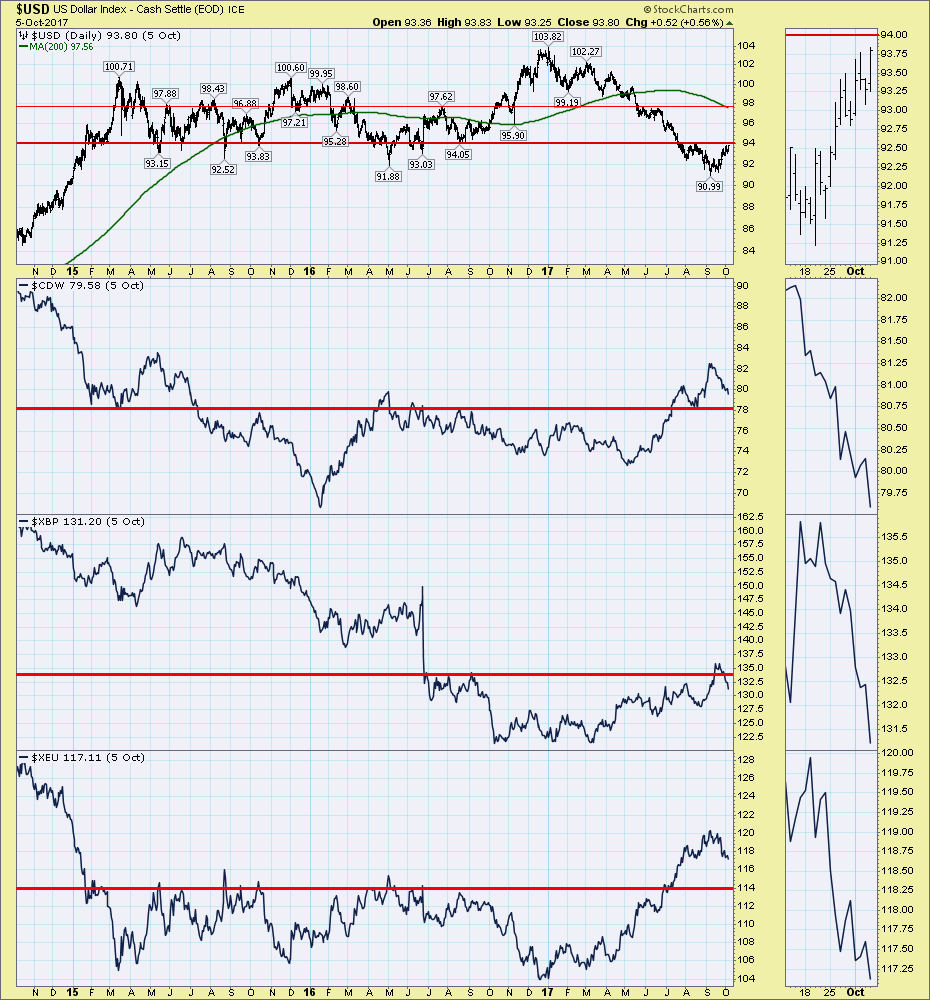
This week the US Dollar climbed to its highest level in two months. For those who have been following the Commodities Countdown articles, the reversal in the $USD was expected from the big downtrend... Read More