ChartWatchers December 16, 2017 at 07:37 PM
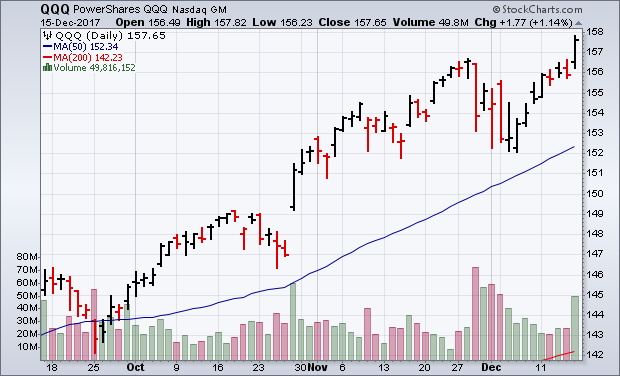
The Nasdaq finally joined the Dow and S&P 500 in record territory on Friday. Chart 1 shows the PowerShares QQQ exceeding its November peak at week's end, and in heavy trading. The QQQ is based on the Nasdaq 100 index which includes the 100 largest non-financial stocks... Read More
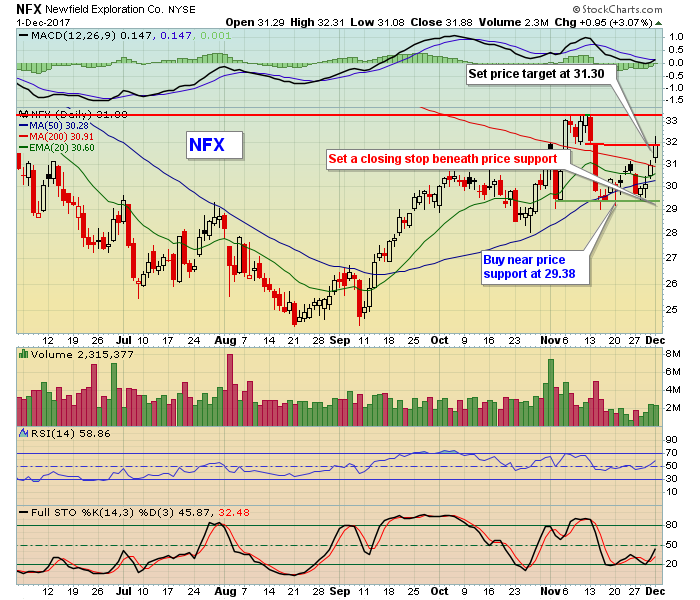
ChartWatchers December 16, 2017 at 07:28 PM
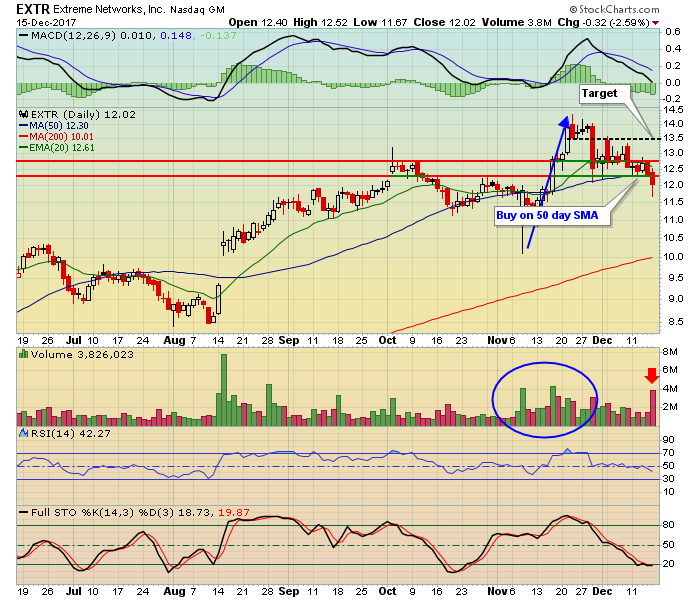
This may sound way too easy, but successful traders manage risk. They don't care about losing money on trades that don't work. They exit those trades and put their capital to work in a better trade... Read More
ChartWatchers December 16, 2017 at 01:28 PM
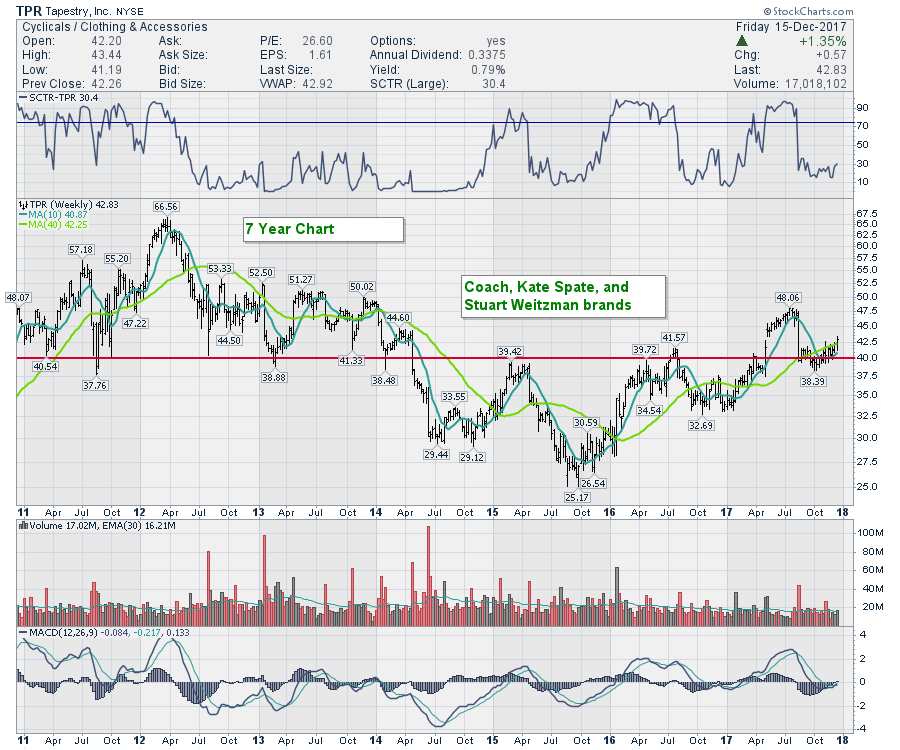
Some winners from this fall included the auto sector in September. They might not all rally, but it is nice when a whole industry group surges together... Read More
ChartWatchers December 16, 2017 at 10:52 AM
Happy holidays! I want to wish everyone a joyous holiday season and here's to a happy, healthy and prosperous 2018! Thank you so much for all your support of StockCharts... Read More
ChartWatchers December 16, 2017 at 05:27 AM
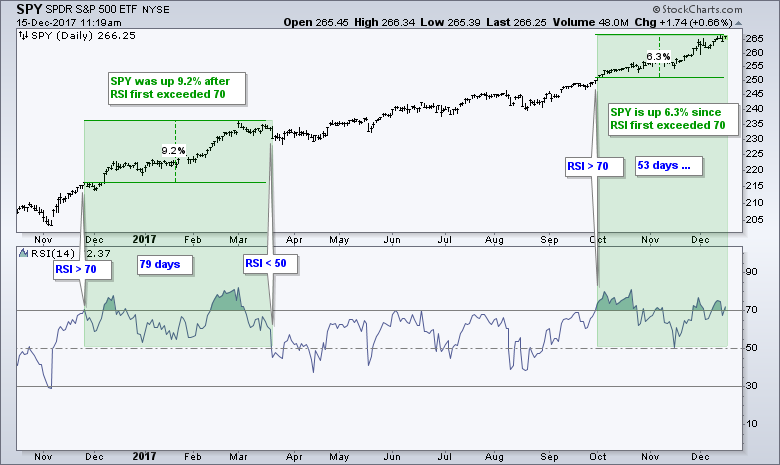
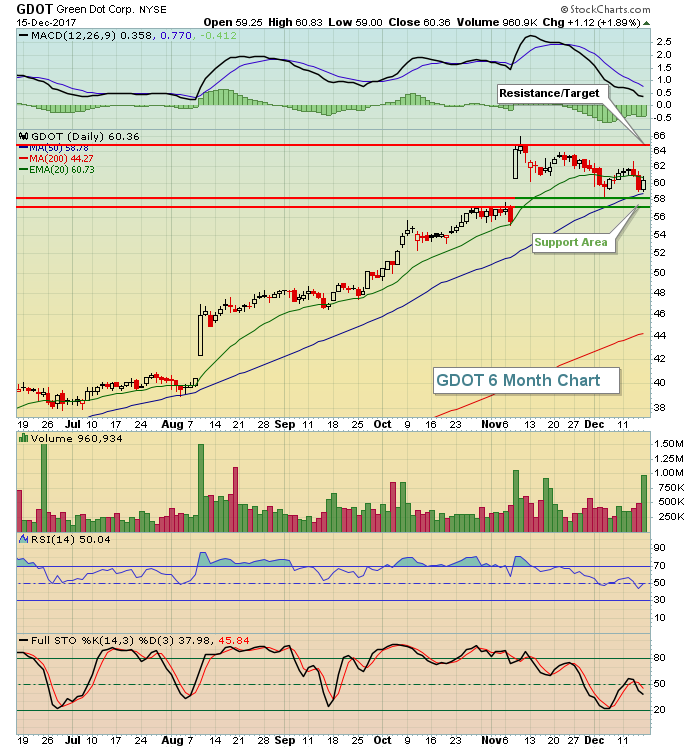
Overbought and oversold are funny terms. Well, actually, they are not that funny when you really think about it. Overbought is often overused in an uptrend and oversold is over used in a downtrend. Let's focus on overbought because that seems to be the term du jour right now... Read More
ChartWatchers December 14, 2017 at 07:17 PM

I haven't talked Small Caps in quite awhile and I think there are some interesting points that need to be made--good and bad. First, the technicals on the S&P 600 are not looking good at all... Read More
ChartWatchers December 02, 2017 at 03:34 PM
'Tis the season and I'd first like to wish everyone a happy holiday season. To health, happiness and prosperity! Feel free to sing along...... Read More
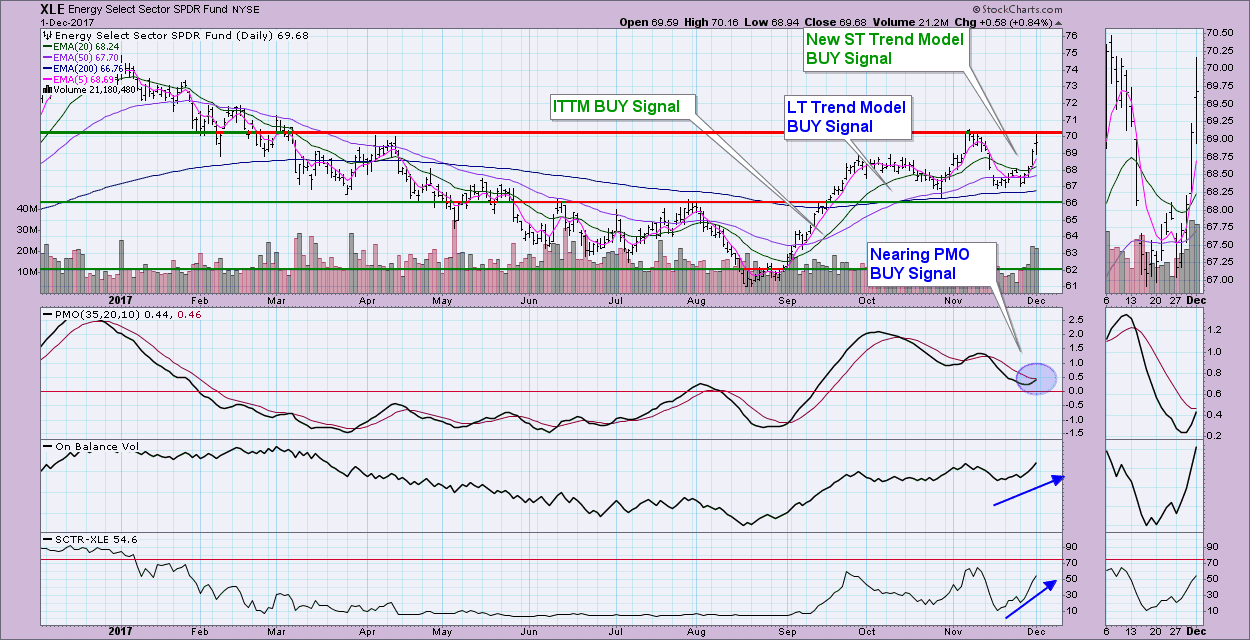
ChartWatchers December 02, 2017 at 03:28 PM
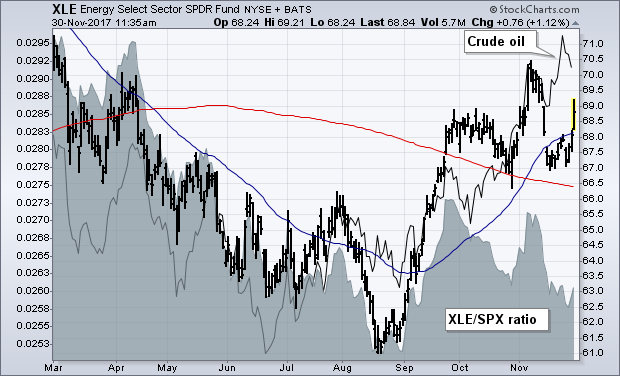
Energy shares are finally showing some bounce. The daily bars in the chart below shows the Energy Sector SPDR (XLE) climbing above its 50-day average today. The XLE is bouncing off chart support along its late October low and its 200-day moving average... Read More
ChartWatchers December 02, 2017 at 02:08 PM
I love to combine bullish seasonality with strong or strengthening technical conditions. As we move into December, it's important to realize that there has been no better month for the S&P 500 since 1950 than December, which has produced annualized returns of +19.51%... Read More
ChartWatchers December 02, 2017 at 10:12 AM
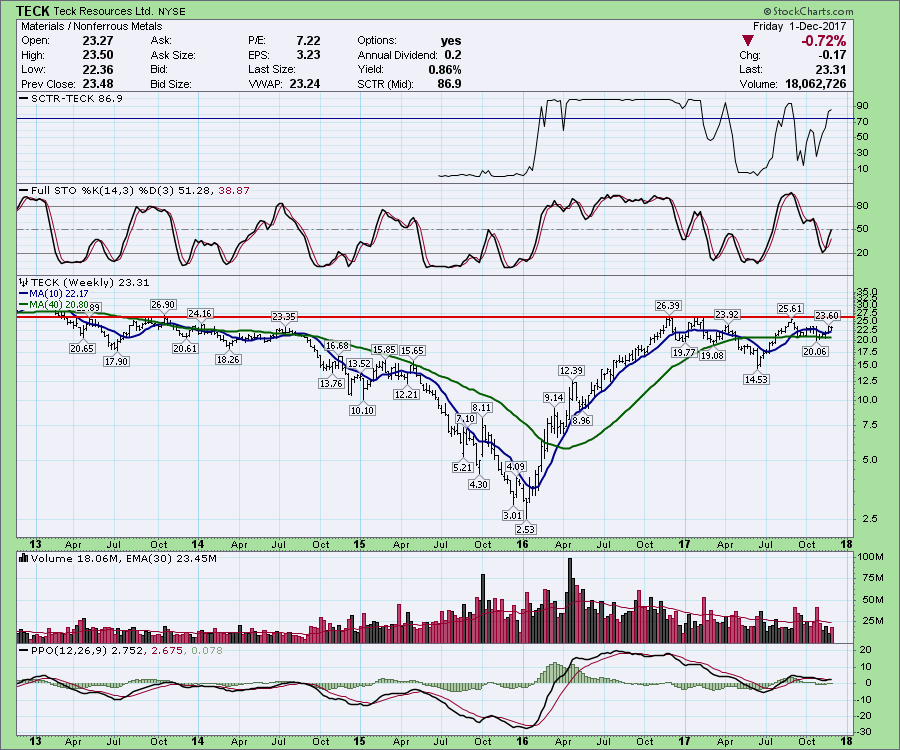
One of key principals of a global bull market is the major moves in the sectors as the market expands. As we head into 2018, there are a significant number of charts that suggest we could be on the platform for a significant move in commodities... Read More
ChartWatchers December 02, 2017 at 02:46 AM
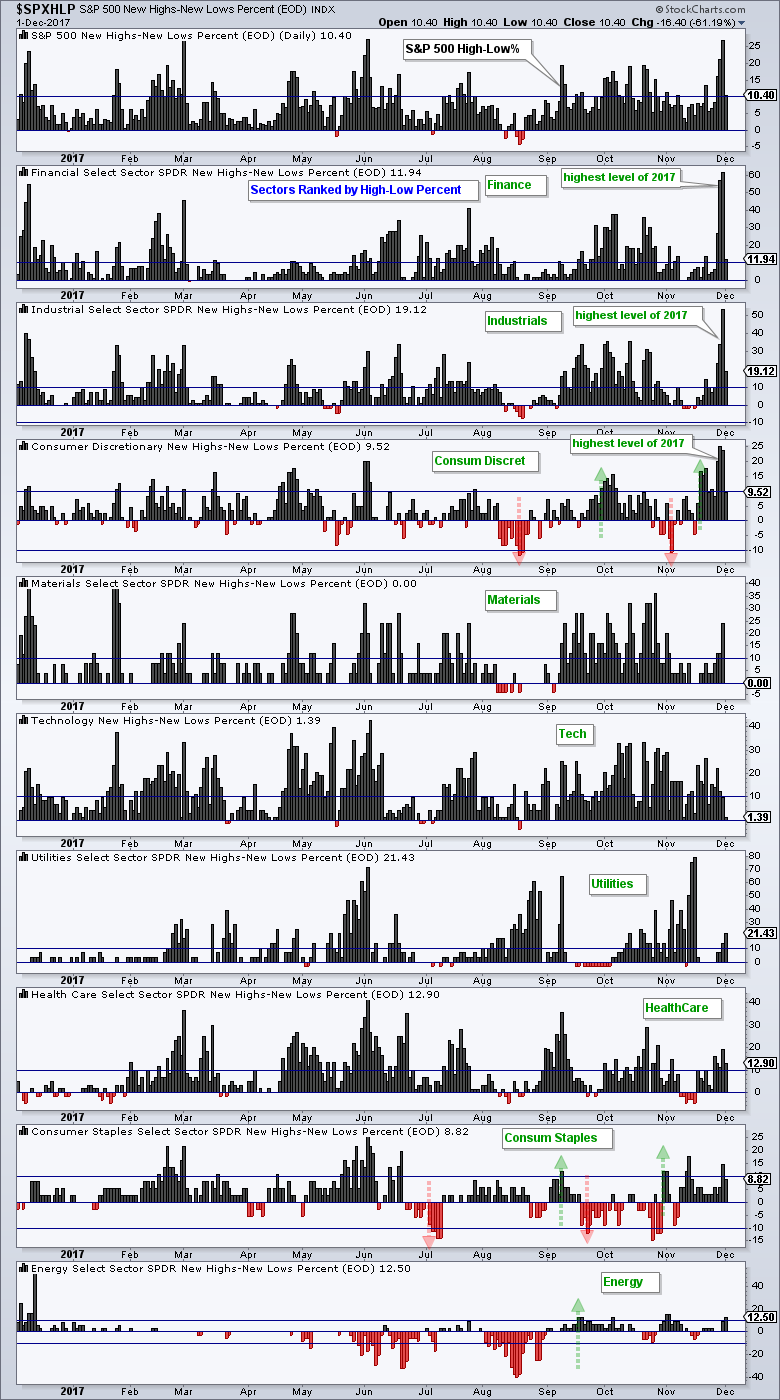
Chartists can plot High-Low Percent for the nine sectors to identify areas of strength within the stock market. The chart below shows the High-Low Percent ranked by this week's highest value... Read More
ChartWatchers December 01, 2017 at 07:00 PM
The energy sector has been on a bit of a rollercoaster the three months, moving from deep lows in August to a new trading range of large percentage highs and lows... Read More