
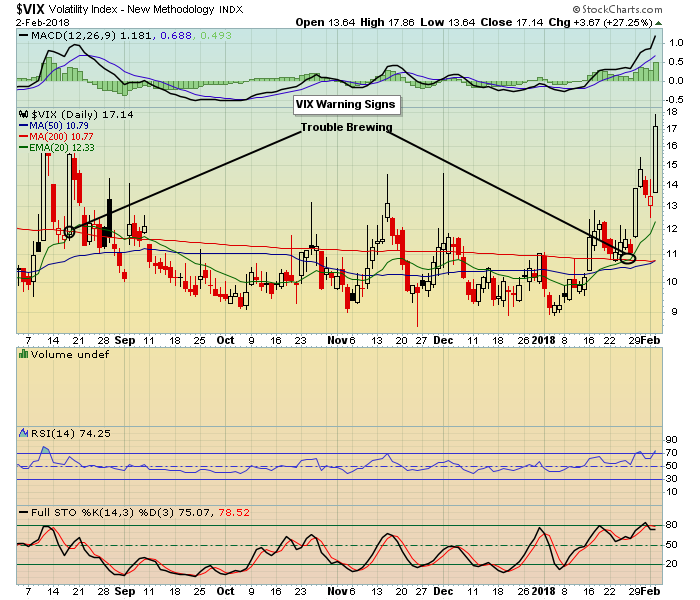
Traders who are "all in" on the long side hate days like this past Friday when the market got slammed big time, with the Dow down 2.6%, the NASDAQ down 2.1% and the S&P down 2%, the worst overall showing in two years. And if you're wondering if traders were scared on the selling all you have to do is take a look at the VIX which shot up 30% as it reached levels not seen since late 2016.
Maybe the most interesting thing - or not - is earnings season has been determined by the analysts to so far have been quite successful with anywhere from 70-80% of companies beating expectations. Thus, many traders may be thinking Friday's sell off makes no sense while others understand completely that the market got ahead of itself and had already "baked in" those solid earnings.
I started seeing signs of market fatigue on January 25 when I brought to the attention of our members - and as you can see below - that the 20 day moving average on the VIX was about to move above its 200 day, something it had not done since August of last year, and I warned that a cross could result in a decent pullback. Keep in mind this was forming just as all of the major indexes were hitting their all time highs and were violently overbought. So what did we do? We laid low, trimming the few stocks that had become trade alerts, reminding members to honor all stops and keep more capital than usual in case the selling did occur.
 Having the foresight to err on the side of caution at strategic times is a critical component of trading. For example, when we saw the market firming up as we moved into the Fall of last year, we had as many as 8 active trades at once, plenty for most traders to deal with at any given time. And we also had tremendous results for 2017 where our trades outperformed the S&P by 5 to 1 on a risk adjusted basis with the key being tight, justifiable stops at important technical and price support levels in case a trade went against us. In fact, going back to March of last year when we began formally tracking our results, the average loss on those trades that failed was just over 2%. That's containment. How many active trades have we had out more lately? One as of today, with a reward to risk of 4 to 1 to the upside and a stop of 2% if it goes against us.
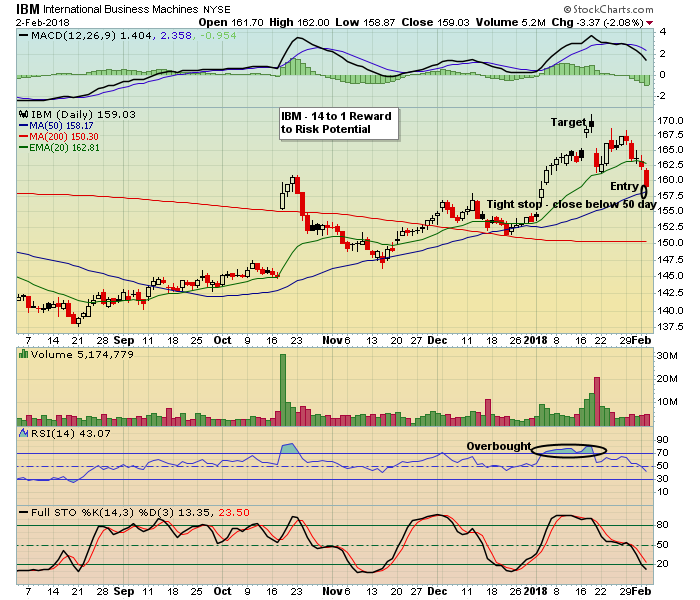
I have to tell you that this very overdue selling we saw last week is most welcomed because once things settle down we are going to be looking at some high reward to risk trading candidates, especially if we are patient. One that comes to mind right away is IBM, a company that had very strong earnings, made a nice move higher and has since pulled back to a level that could make it a great trading candidate.
 Now that Q4 earnings season is starting to wind down we are going to be uncovering a treasure trove of stocks that beat earnings expectations, both on the top and bottom line, and have solid looking charts. We'll pick these stocks up during our scanning process and add them to our "Candidate Tracker" which will become a part of our ChartList. Then we'll wait patiently for some of these stocks to pull back to key support levels and that's when we'll pounce! If you want to see a sample of our Candidate Tracker, where we'll be adding many potential trading candidates over the next week, just click here.
It's way easier to make nice scores when the market is moving up non stop day after day. It's not so easy when the party comes to a screeching halt and those nice gains turn into serious losses. I can't emphasize enough how important it is to maintain discipline throughout the entire process, especially minimizing losses when a trade goes against you. This way when new opportunities arise you will be in a position to take full advantage of them.
At your service,
John Hopkins
EarningsBeats.com