Identifying The Candidates
I've included the month-by-month seasonal information for all NASDAQ 100 ($NDX) stocks in an Excel spreadsheet. In an effort to identify the best seasonal stocks on the NDX, I first considered the number of years history for each stock. For instance, I eliminated JD.com (JD) because it only has 5 years of history. JD performs very well beginning in February, but I want a more representative sample size to feel good about its seasonal tendencies. For this ChartWatchers article, I eliminated NDX stocks having less than 10 years of history. That criteria eliminated both Tesla (TSLA) and Charter Communications (CHTR), which have performed exceptionally well from February through April.
The next step was to look at the best of the best when it comes to overall annual performance. I didn't consider any stocks that have averaged gaining less than 25% per year OR 15% from February through April. That eliminated some very solid candidates like Apple (AAPL) and Netease.com (NTES), both of which have solid long-term track records.
Finally, the percentage gain (average seasonal gain from February through April divided by annual average gain) had to be at least 40%. This eliminated many NDX stocks as the NDX itself has the tendency to perform best in October and November.
The Results
There were only two stocks in the NDX that met all of the requirements above. 2 out of 100. So these two stocks are my February to April winners.
1. priceline.com (PCLN):
The seasonal performance of PCLN is downright jaw-dropping. Over the past two decades, PCLN has posted the following average returns by calendar month:
February: +8.2%
March: +7.8%
April: +13.2%
These gains, totaling 29.2%, represent nearly 90% of its average annual return of 33%. In addition to seasonal strength, PCLN looks like it's in the process of printing an inverse right shoulder in a bullish inverse head & shoulders continuation pattern:
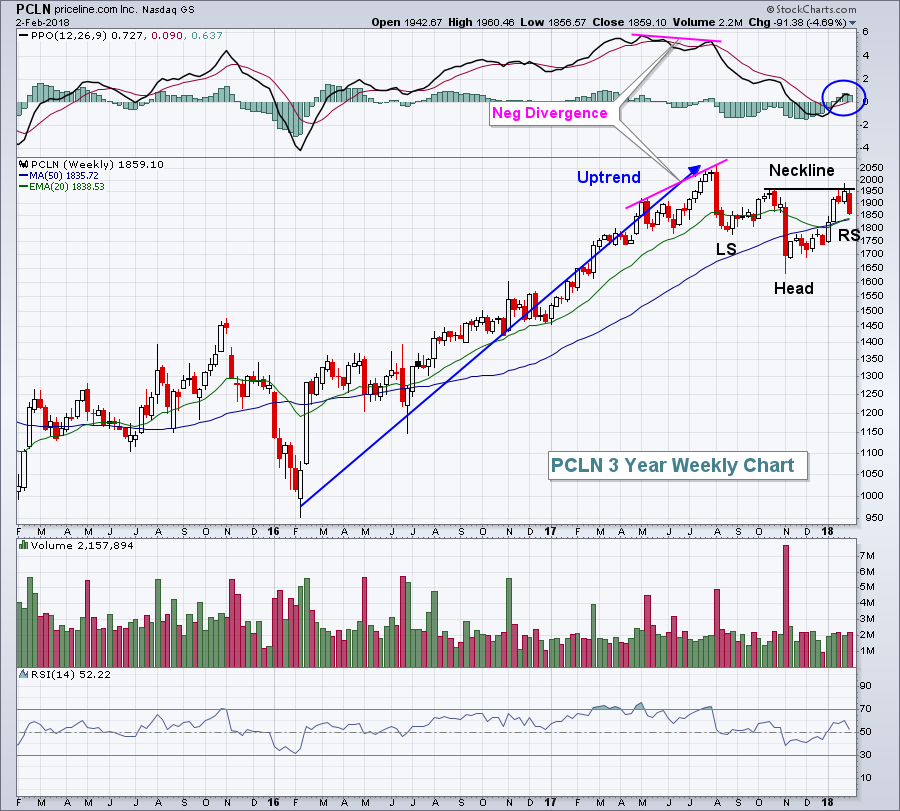 This pattern began after a negative divergence emerged, suggesting that price momentum was slowing. That final high in July 2017 was accompanied by average volume at best, another signal of slowing momentum. That resulted in the formation of the current inverse head & shoulders pattern. Given PCLN's history of seasonal bullishness, I'd expect to see this technical pattern confirmed with higher prices ahead.
2. Adobe Systems (ADBE):
ADBE has earned roughly two-thirds of its gains over the past 20 years during the February through April period. It's returned roughly 27% per year with the following average returns by upcoming calendar months:
February: +4.2%
March: +8.5%
April: +5.1%
These numbers can't quite match PCLN's, but they aren't too shabby, totaling 17.8% over a three month period. ADBE wasn't hit as hard as PCLN this past week and remains above its 20 day EMA:
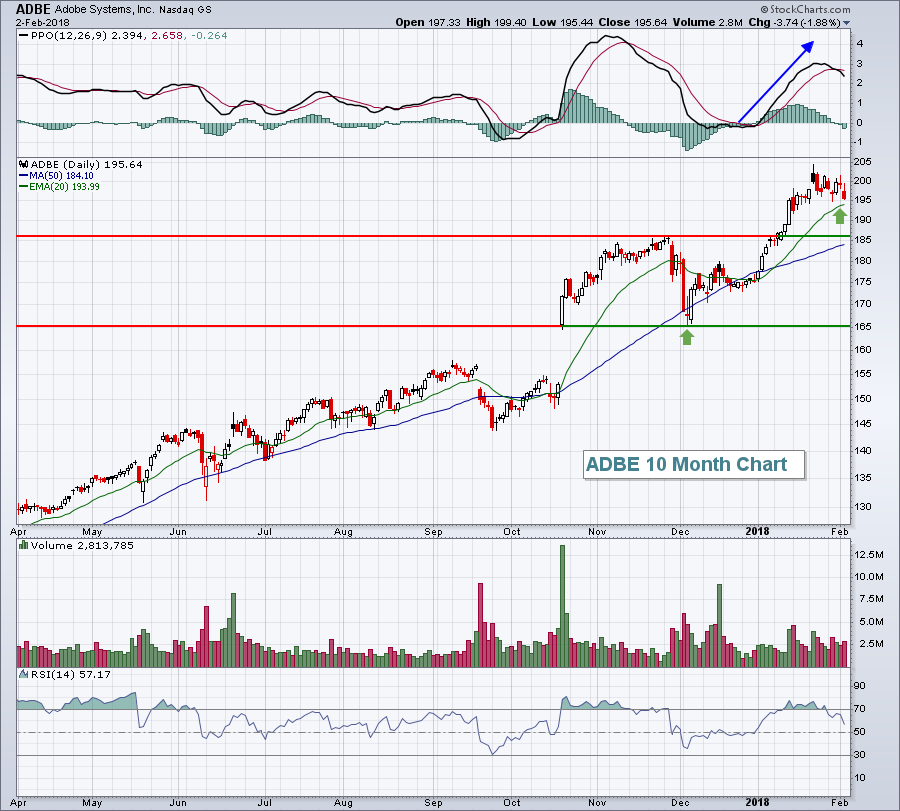 Adobe's quarterly results in October were stellar and you can see the top of that gap support held nicely on the late-November and early-December selling. The PPO turned higher off centerline support at the start of this year and it shows that price momentum was very strong at the most recent price high. That usually leads to successful tests of 20 day EMA support. We're nearing that test now. Should the 20 day EMA support fail to hold, price support now resides close to 186.
Happy trading!
Tom
