 The principle of confirmation is important to the application of Dow Theory. This principle asserts that the Averages, Dow Industrials and Dow Transports, should confirm each other when making new highs. In other words, both should make new highs to affirm the broad market trend. Failure by one results in a non-confirmation that reflects underlying weakness.
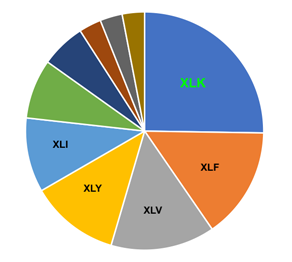
Chartists can apply this confirmation principle to sector analysis and assess the state of broader market. I am not going to use all ten sectors because the bottom five sectors account for less than a quarter of the S&P 500. Also note that the Materials SPDR, Utilities SPDR and Real Estate SPDR weigh less than 3% each.
The top five sectors account for over three-quarters of the S&P 500 and these are the main drivers for the benchmark index. These include the Technology SPDR (25%), the Financials SPDR (15%), the Health Care SPDR (13.7%), the Consumer Discretionary SPDR (12.3%) and the Industrials SPDR (10.1%).
Four of these five sectors belong to the "offensive" side of the market and these are the ones we want to see leading. Healthcare is traditionally a "defensive" sector, but there are a fair number of biotechs in this sector. Regardless, it is still the third largest sector and cannot be ignored because of its influence.
The chart below shows these five sectors with the largest at the top (tech) and the smallest at the bottom (industrials). First, notice that the Technology SPDR was the only one to record a new high in late February (green dashed line). The other four did not reach their prior highs and did not confirm the largest sector (red dashed lines). These non-confirmations reflects narrowing participation. As a comparison, note that all five recorded new highs in late January.
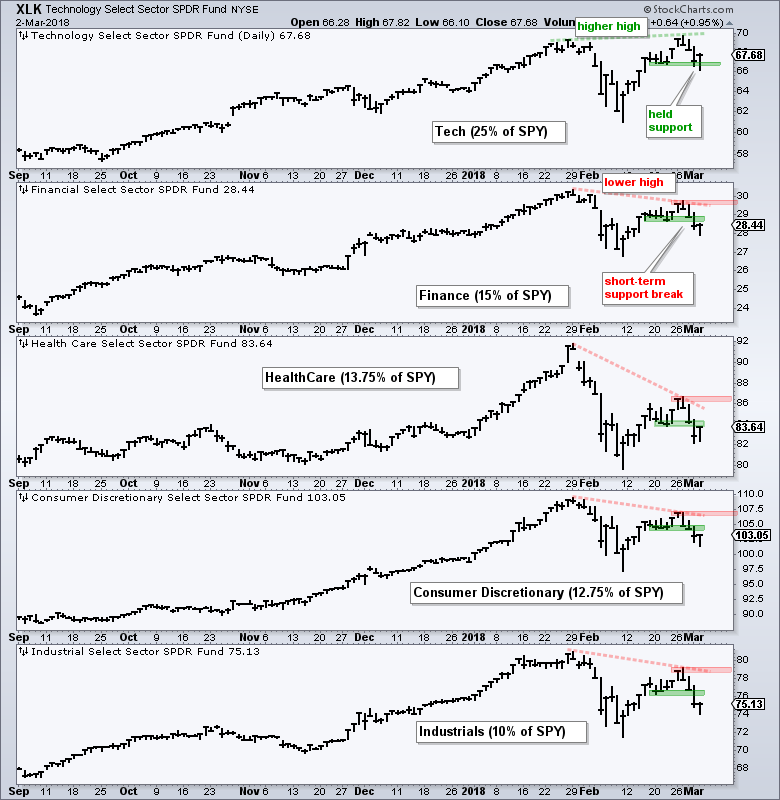
The green zones mark short-term support from the late February lows. Notice that the Technology SPDR held this support level, but the other four broke their support levels. Again, we see technology holding up well, but the other four breaking support. Even though technology still looks strong, the other four sectors, which account for 51% of the S&P 500, broke support and after then non-confirmations.
The red shading now marks resistance based on the late February highs for the four sectors that broke support. Upside breakouts are needed to put these four back on the bullish track, and hence the broader market. Chartists should also watch technology because it is by far the largest sector and a support break would seriously weigh on the broader market.
Plan Your Trade and Trade Your Plan.
- Arthur Hill, CMT
Senior Technical Analyst, StockCharts.com
Book: Define the Trend and Trade the Trend
Twitter: Follow @ArthurHill
