Editor's Note: This article was originally published in John Murphy's Market Message on Friday, March 2nd at 12:26pm ET
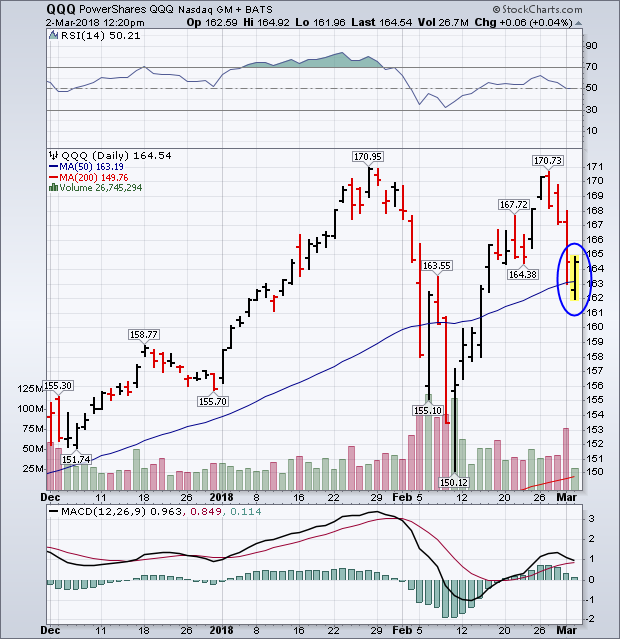
Wednesday's message showed the PowerShares QQQ (representing the Nasdaq 100 Index) pulling back from overhead resistance at its late January peak. That suggested profit-taking in the technology-dominated QQQ and the rest of the market. It also suggested a retest of its 50-day moving average. Chart 1 shows that test taking place today. Since the QQQ led the market higher during its February rebound, what it does from here will tell us something about the direction of the rest of the market. Wednesday's message noted the absence of strong volume during its recent rebound. While yesterday's selling came in heavier trading. That helped put the market on the defensive.
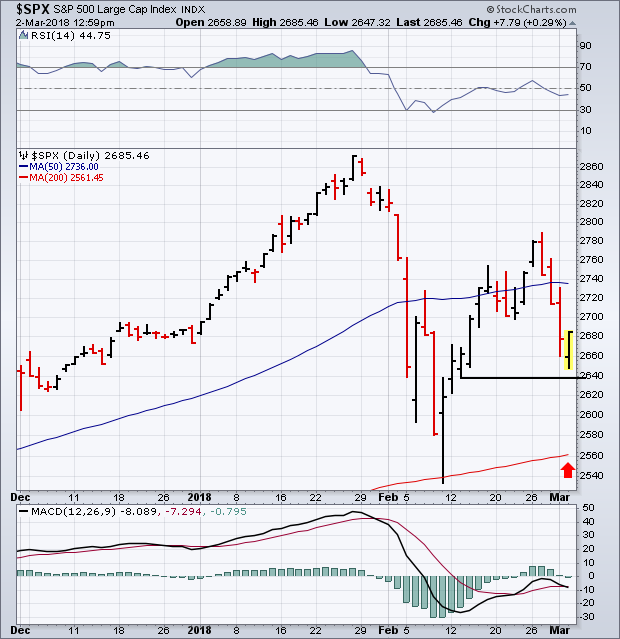
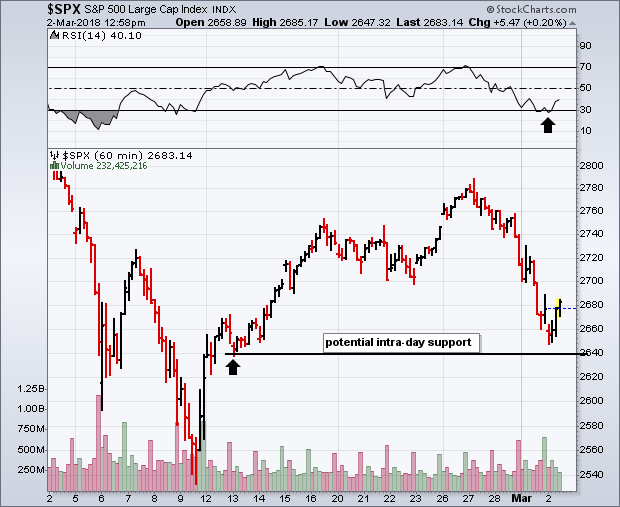
 The daily bars in Chart 2 show the S&P 500 falling back below its 50-day average in late Wednesday trading which ended its February rebound and put it back on the defensive. The SPX is now testing potential support near 2640 which I mentioned on Wednesday (flat line). That can be seen more clearly in the hourly bars in Chart 3 which show the SPX testing a small shelf of support near 2640. The fact that the 14-hour RSI line (top of chart) has reached oversold territory at 30 might also provide some support. If that doesn't hold, a retest of the February low or the 200-day moving average might be in store. That wouldn't be surprising within the context of a normal market correction. Market corrections normally take place in three legs (one down, one up, and another down). We've already had two. We may now be in the third leg which often retests a previous low to form "double bottom" price pattern. That could happen again. But only if the 2640 level doesn't hold.


