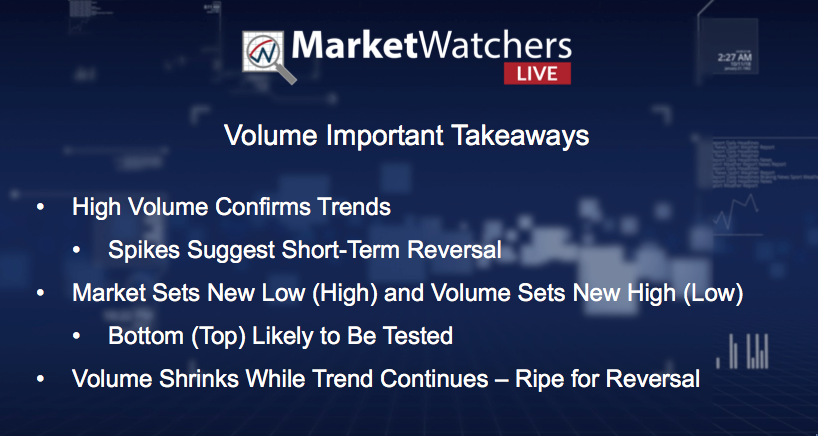
On Friday's MarketWatchers LIVE program, I did a workshop on volume. Highly recommend you check it out on the StockCharts YouTube Channel or it is available under the webinars tab until Monday's show begins. We talk about volume all the time, but why is understanding and following it important? Well, Dr. Alexander Elder in his book, The New Trading for a Living (available in the StockCharts Store) explains volume can be a very powerful tool to determine the financial and emotional involvement in a particular stock or index.
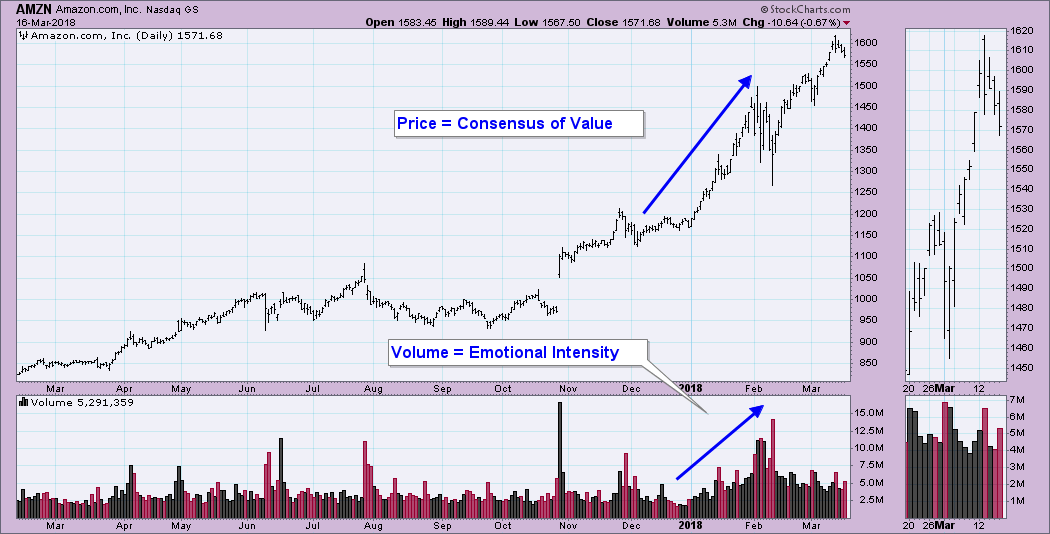
Remember that a unit of volume represents a transaction of a buyer and seller. If you want to buy a stock, you have to find a seller. There are two people involved, so at the end of the day, one of them is a loser. Price represents the "value consensus" and volume represents the "intensity" of emotion. When they go hand in hand as below, volume confirms the price trend. At the end of the move volume spiked in the first day or two of February, price changed direction and started down. This is a 'fear factor' explosion that will feed on itself and drive prices lower.
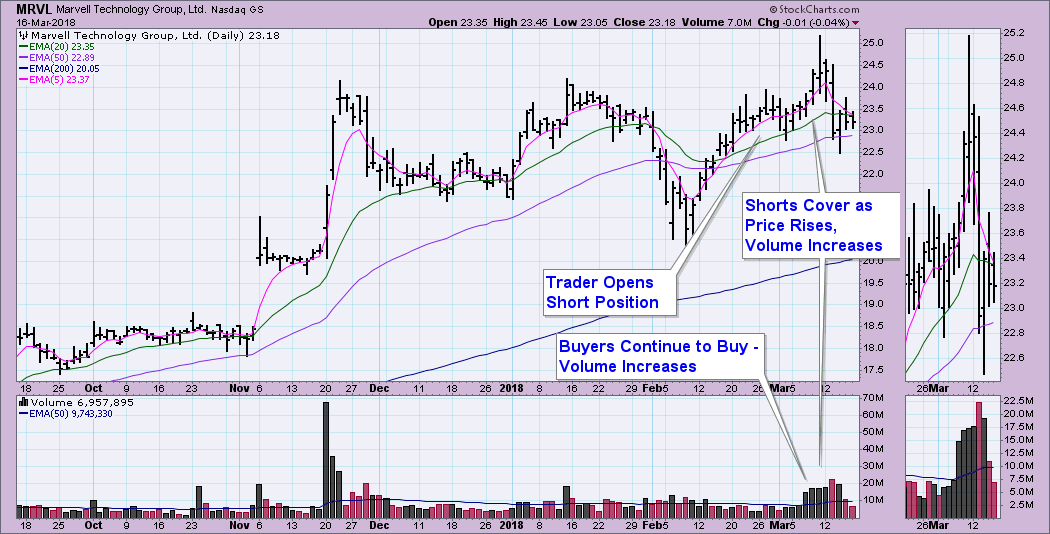
You'll often hear how volume leads price. This holds true and when it doesn't lead price, that's a problem and likely a sign of a reversal. Here's how volume can lead price. Let's take a "short squeeze" as an example. Trader shorts a position, but it becomes apparent that price is going up and sentiment is bullish, bulls have taken control; the savvy trader will close that position quickly. When he does, that increases volume and price continues higher. Now the less savvy investors start to cover their positions and volume and price increase. This feeds on itself. Bulls are happy to continue to buy and bears have been caught or squeezed out of their position as the rally continues on. Volume is increasing and price is increasing with it.
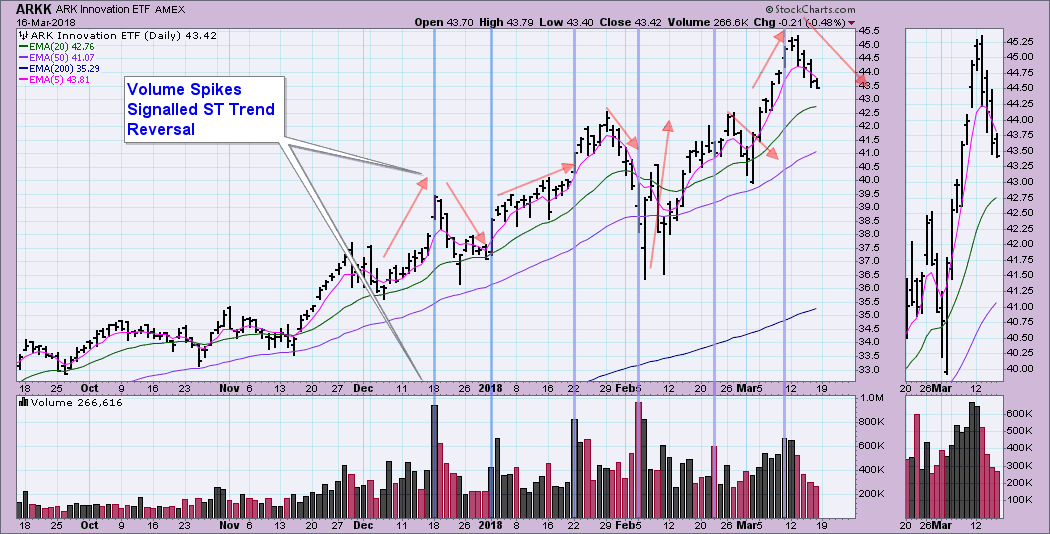
Sometimes we see volume spikes. A volume spike is usually seen on earnings or some 'report' or environmental change that moves traders into the emotional zone and they trade accordingly. If you see these spikes, it is an explosion of euphoria (or fear on the downside). Typically you will see a short-term trend reversal after these spikes. Also notice as volume begins to dry up, there is a shift in the price trend. It certainly isn't perfect, but you can see how volume measures intensity of emotion and price is the consensus of value.
I'll finish with the "Volume Takeaways" slide from today's program. I'll cover the volume indicators as well as spotting divergences in a future article. To read more on volume, a ChartSchool search on "Volume" should help. Additionally you can purchase Dr. Elder's book "The New Trading for a Living" or you'll find it in the CMT curriculum. Both are offered in the StockCharts Store.
Helpful DecisionPoint Links:
DecisionPoint Shared ChartList and DecisionPoint Chart Gallery
Price Momentum Oscillator (PMO)
Swenlin Trading Oscillators (STO-B and STO-V)
Technical Analysis is a windsock, not a crystal ball.
Happy Charting!
- Erin
**Don't miss DecisionPoint Commentary! Add your email below to be notified of new updates"**
