Editor's Note: This article was originally published in John Murphy's Market Message on Saturday, April 7th at 7:55am ET
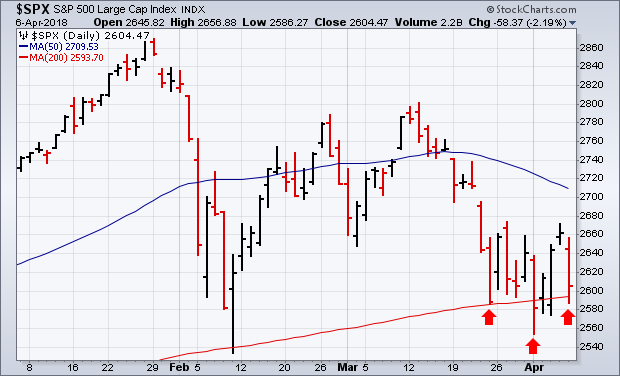
Just when it looked like the stock market was about to recover from the first two rounds of tariff threats, stocks were hit with a third and bigger $100 billion tariff threat after the close on Thursday. As a result, stock market indexes fell more than 2% on Friday with all market sectors in the red. That pushed all three major stock indexes back into the red for the week. Foreign stocks also fell sharply. After the first two tariff-induced selloffs, stocks rebounded on assurances that the tariff threats were a negotiating ploy; and that negotiations were going on behind the scenes between the U.S. and China. Friday's negative reaction suggests that markets are no longer buying that story. The president talked about the possibility of short term "pain", while his Treasury Secretary said on CNBC that a trade war was possible. Meanwhile, China denied that any negotiations were taking place. In that dangerous and unpredictable environment, it seems fair to suggest that any form of rational market analysis -- whether it's economic, fundamental, or technical -- takes a back seat to daily headlines. It's hard to do business when someone has their thumb on the scale. And right now, there's a very heavy thumb on the market scale. Friday's selling wiped out three days of gains. Next week will likely see another test of underlying support levels. Chart 1 shows the S&P 500 falling back to its 200-day moving average. It bounced off its 200-day line twice in the last month (red arrows). A third test of support is usually the most important one.