Editor's Note: This article was originally published in John Murphy's Market Message on Friday, May 4th at 3:50pm EST
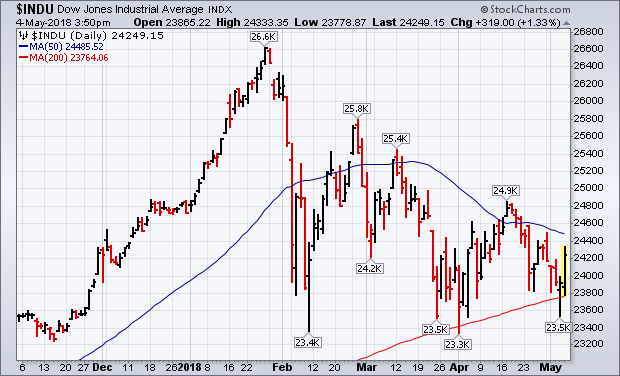
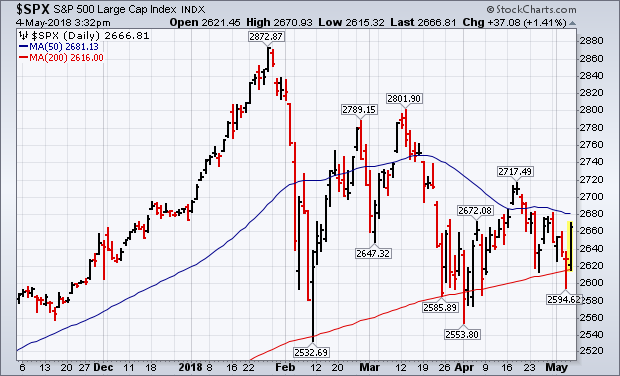
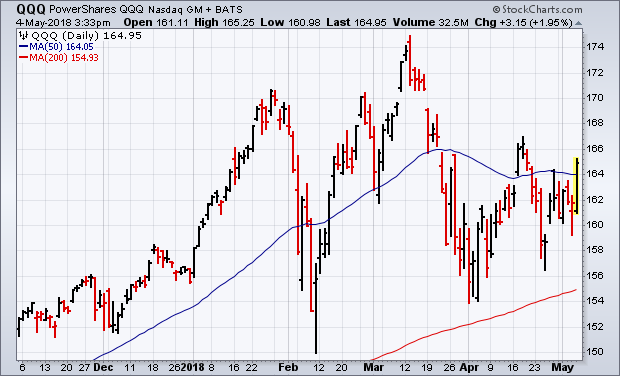
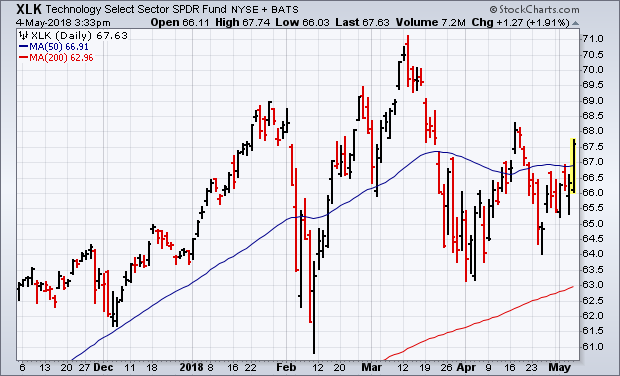
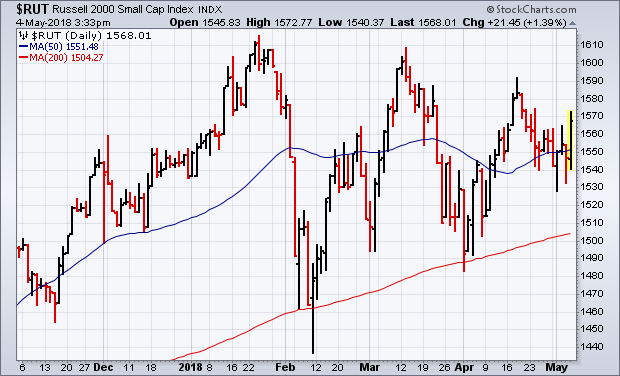
STOCKS REBOUND OFF 200-DAY LINES... Chart 1 shows the Dow surging more than 300 points after surviving another test of its 200-day average yesterday. Chart 2 shows the S&P 500 doing just as well. Both indexes still need to exceed their 50-day average and their mid-April peak, however, to signal that stocks are turning higher. The Nasdaq market is doing even better. Chart 3 shows the PowerShares Nasdaq 100 (QQQ) trading back over its 50-day average. The Technology SPDR (XLK), which is the day's strongest sector, has done the same (Chart 4). The tech sector is being led higher by Apple (AAPL), semiconductors, and Internet stocks. Small caps continue to hold up better than large caps. Chart 5 shows the Russell 2000 Small Cap Index ($RUT) also climbing back over its 50-day average. This appears to be the third successful test of support near 200-day moving averages. That's usually the most important one. All market sectors are in the black led by technology, staples, and financials.