ChartWatchers December 15, 2018 at 04:26 PM
It looks like another tough month for the markets as year-end approaches. The index swings are getting increasingly aggressive and it feels like nearly every sector is getting yanked around... Read More
ChartWatchers December 15, 2018 at 03:06 PM
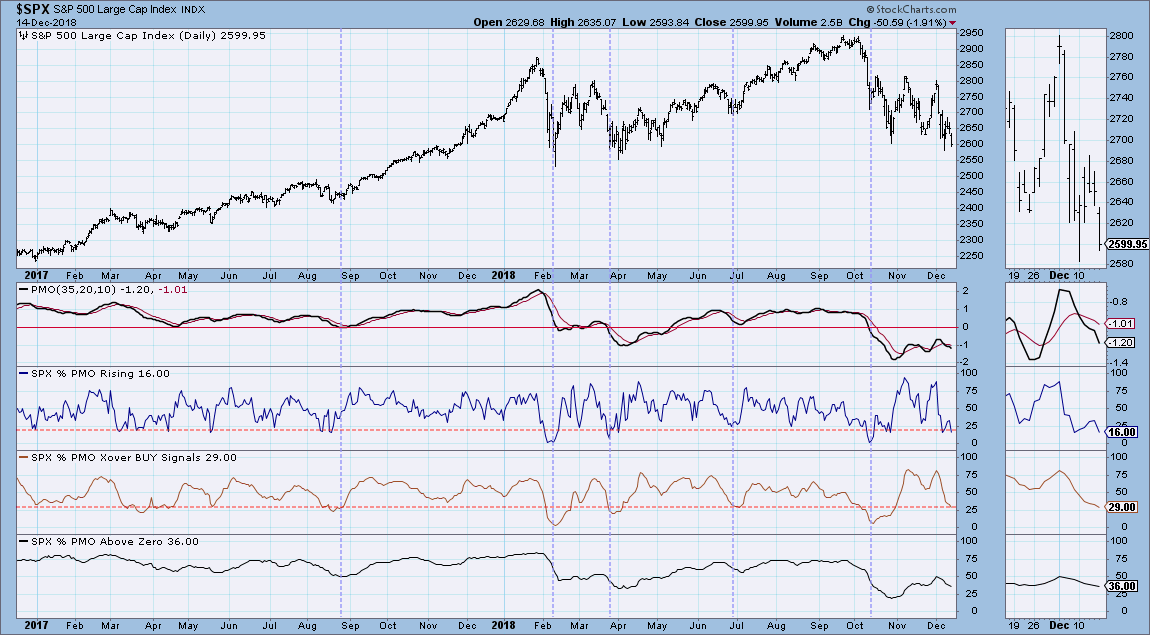
The Price Momentum Oscillator (PMO) is a great measure of acceleration/deceleration of price for individual entities... Read More
ChartWatchers December 15, 2018 at 12:55 PM
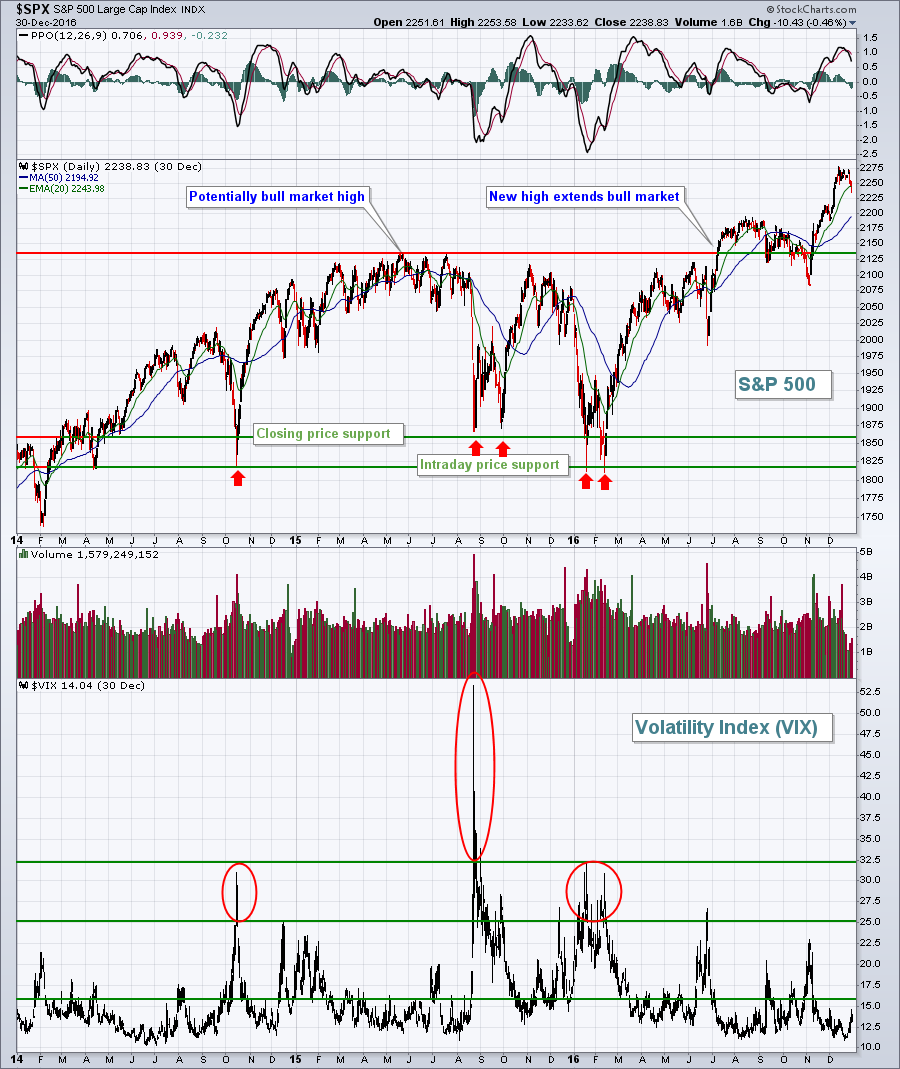
Not a whole lot. I guess there are three primary differences. First, there's the percentage drop as corrections are generally considered to see a drop of less than 20%, while bear markets tend to see declines well in excess of 20%... Read More
ChartWatchers December 15, 2018 at 10:54 AM
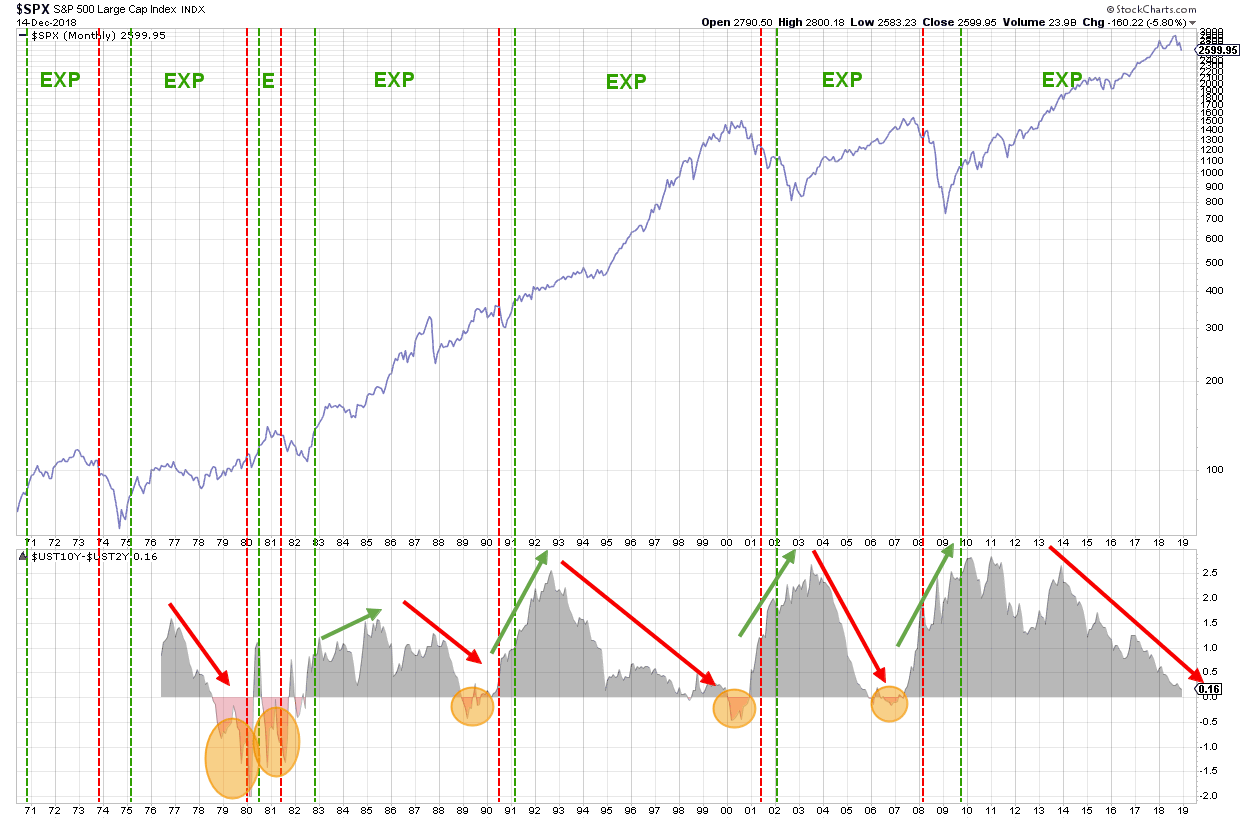
The "Yield Curve" is a term often used in finance and refers to the relationship between (government) bonds with various maturities. The "Normal" relationship between the yield on various maturities is that the longer you lend money to someone... Read More
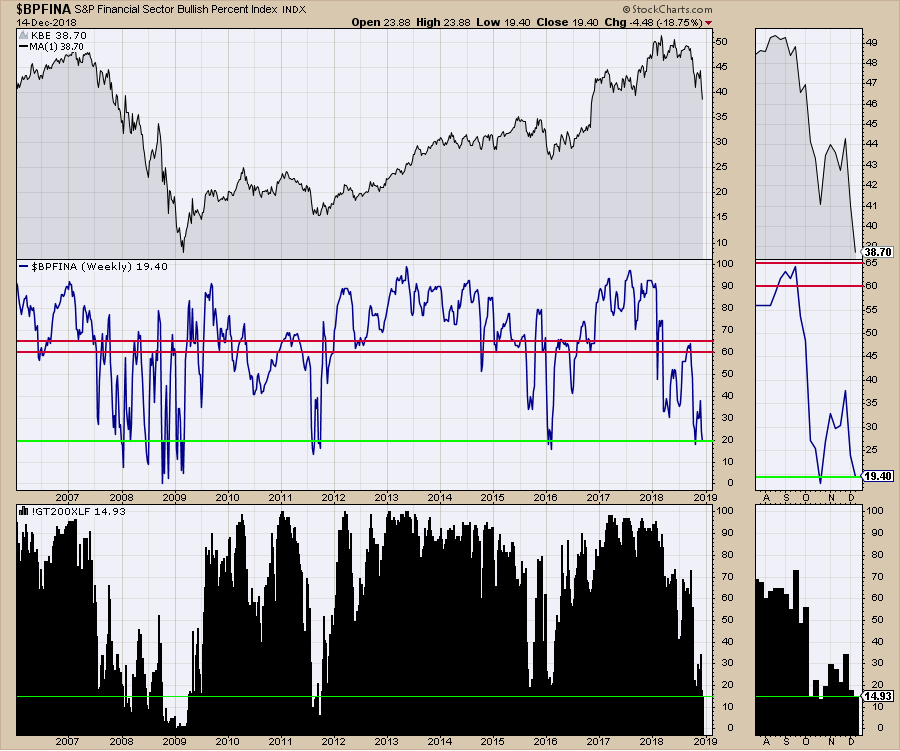
ChartWatchers December 15, 2018 at 10:51 AM
First, I'd like to wish everyone a Merry Christmas and a Happy New Year! 2018 has been a wild ride with volatility returning to extreme levels. Unfortunately, 2019 looks like it will get even worse. I believe we're in a bear market and, at EarningsBeats... Read More
ChartWatchers December 15, 2018 at 05:11 AM

As obvious as it seems, lower lows and lower highs are the order of the day in a downtrend. Thus, prices are expected to break prior lows and continue lower when the trend is down... Read More
ChartWatchers December 14, 2018 at 03:49 PM
Editor's Note: This article was originally published in John Murphy's Market Message on Friday, December 14th at 2:32pm ET... Read More
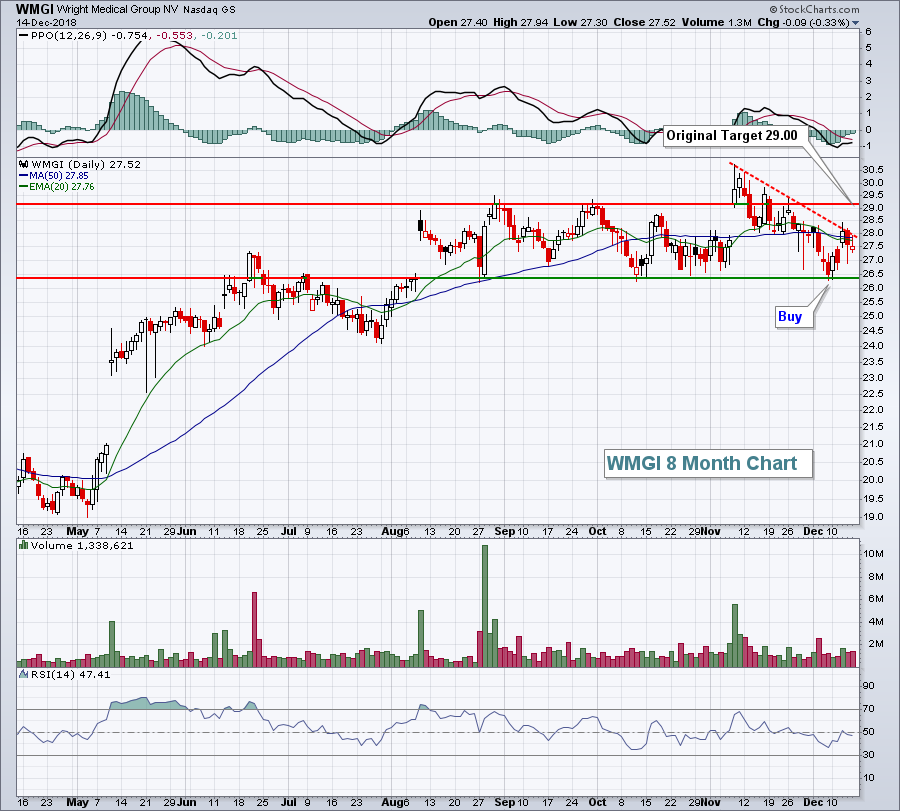
ChartWatchers December 01, 2018 at 03:56 PM
Everybody wants the secret formula. You know, the one where you never lose money. Well, I haven't found THAT one yet, but trading companies that have recently beaten Wall Street revenue and EPS estimates is a fairly solid runner-up strategy... Read More
ChartWatchers December 01, 2018 at 02:46 PM
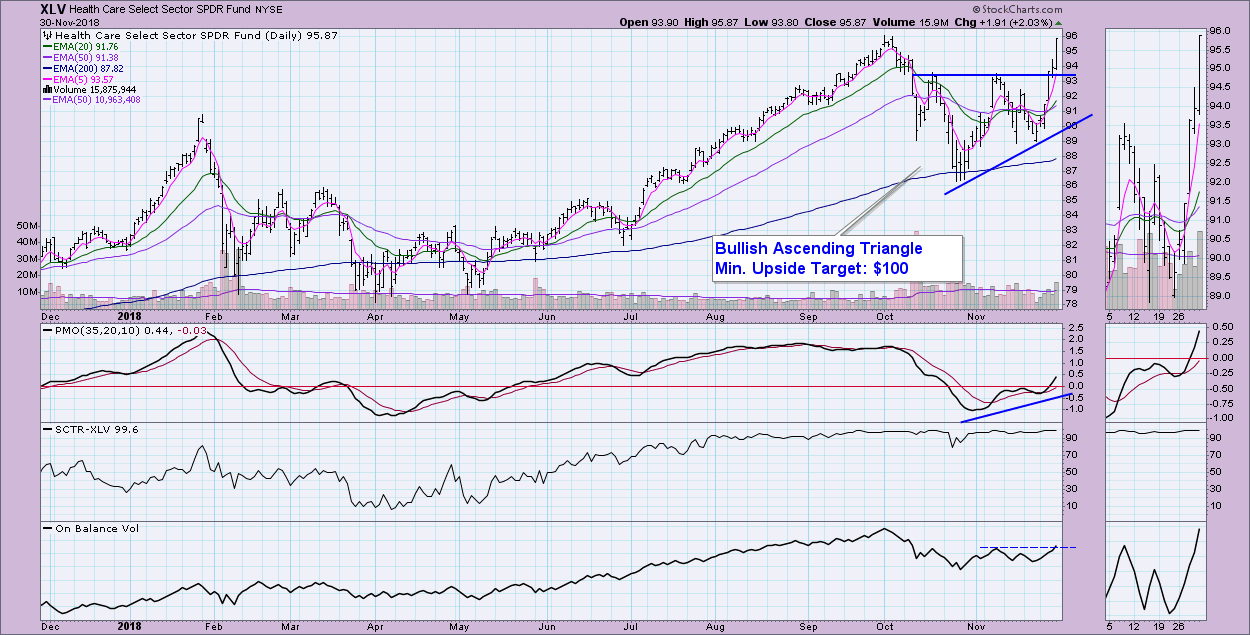
In my Thursday article in the DecisionPoint blog, I discussed the new PMO BUY signals on the DP Scoreboards, finishing off the article with a chart of the Healthcare Sector ETF (XLV) after I received a new Intermediate-Term Trend Model BUY signal (a positive 20/50-EMA crossover o... Read More
ChartWatchers December 01, 2018 at 09:55 AM
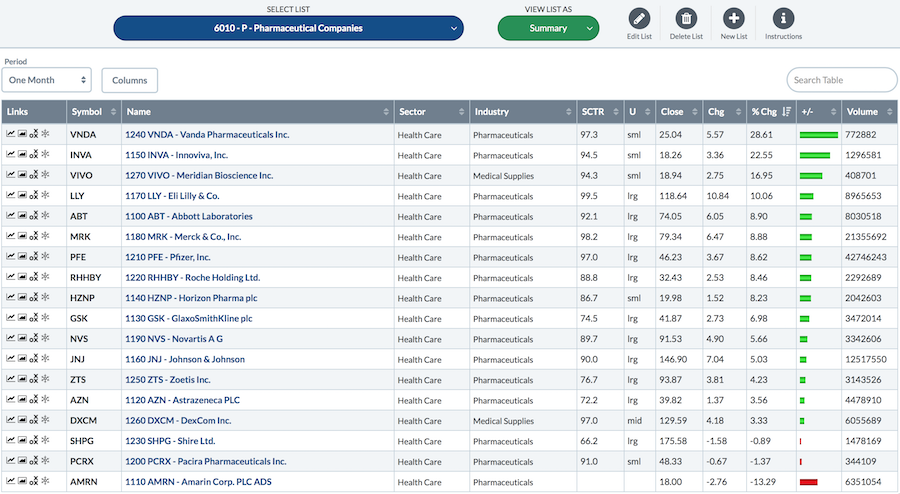
Pharmaceutical stocks were a standout in November. The big global names had an exceptional month. While they are categorized as defensive stocks, these heavyweights have very powerful biotechnology investments... Read More
ChartWatchers December 01, 2018 at 05:42 AM

The S&P 500 is the most widely used benchmark for U.S. stocks and the 200-day SMA is the most widely used moving average. Together, chartists can use the S&P 500 and the 200-day SMA to determine the broad trend for the stock market... Read More