Not a whole lot.
I guess there are three primary differences. First, there's the percentage drop as corrections are generally considered to see a drop of less than 20%, while bear markets tend to see declines well in excess of 20%. Second, a bear market tends to last longer than a correction as the latter is nothing more than a basing period (that can still be extremely emotional) during a bull market. Corrections are actually quite constructive for a longer-term rally. Finally, there's a much stronger likelihood of an economic recession during a bear market. Corrections are mostly accompanied by a slowdown in economic growth, but GDP typically remains positive.
My topic for this article was prompted by an email that I received from a subscriber to my daily Trading Places blog articles. Here's a quote from that email:
"Tom, you've said for months that this is just a market correction. At what point would you say this is the start of a bear market? Please help me understand the difference."
Let me start by providing a little stock market history. If we use 20% as the minimum downside threshold to have a bear market, then we've had 10 such bear markets since I was born in 1961. (Please do not do the math. And if you do the math, please don't remind me of the answer). Below are the total number of days spent in bull markets vs. bear markets in my lifetime:
Days spent in a bull market: 17,384
Days spent in a bear market: 3,548
We have been in bull markets five times longer than we've been in bear markets since 1961. So my first conclusion from this is that I don't want to err on the side of bearishness unless it's warranted. Most declines and most corrections are not bear markets. Have you ever heard the saying that someone has successfully predicted "19 of the last 2 bear markets?" Most investors/traders, by their very nature tend to be pessimistic. And for very good reason as most people do not enjoy losing money. Losing money makes us very emotional and extreme emotion, ironically, is one of the greatest predictors of market bottoms.
Ok, it's time for a chart. Let's take a look at the correction from 2014 through 2016:
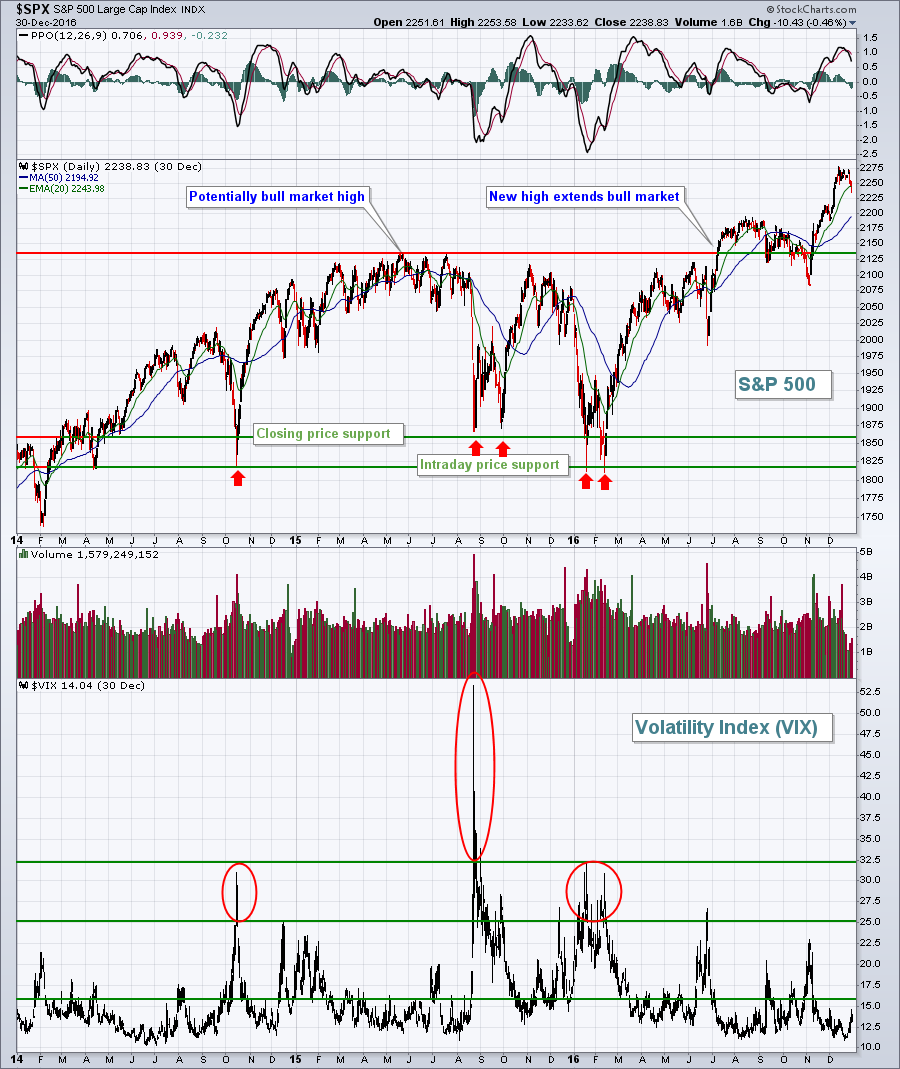 After each of the selloffs that generated high VIX readings, most notably in October 2014, August 2015, and January/February 2016, the VIX settled back down beneath a critical 16/17 support level. Why is that level critical? Well, for starters, bear markets require a certain level of fear to trigger selling episodes when bad news hits. Also, if you look back at the last two bear markets, the VIX never closed beneath 16. Not once. The emotional component would rise to a level to support a bear market, but it didn't stay there - a clue that we were looking at a correction vs. a bear market. The final clue was obvious. Price support from the initial move lower in 2014 was never broken as it held on future emotional market meltdowns. The S&P 500 ultimately broke out to new highs in July 2016 and the bear market discussion ended.
Let's compare that to the current action:
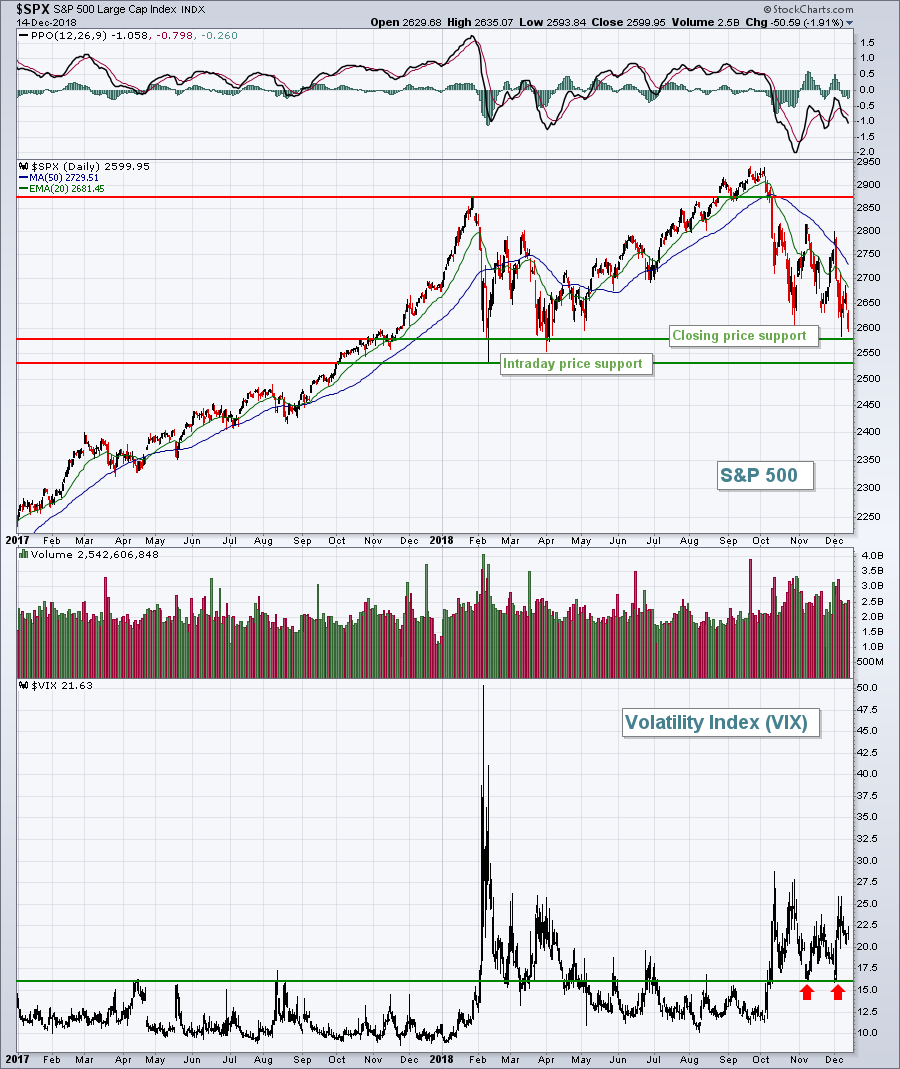 One of the biggest differences now vs. earlier in 2018 is the fact that market rallies have been stymied when the VIX has fallen to 16. That support is holding similar to the past two bear markets. In my opinion, however, the bear market doesn't confirm until we see a price breakdown. Here's the chart of the latest bear market that began in October 2007:
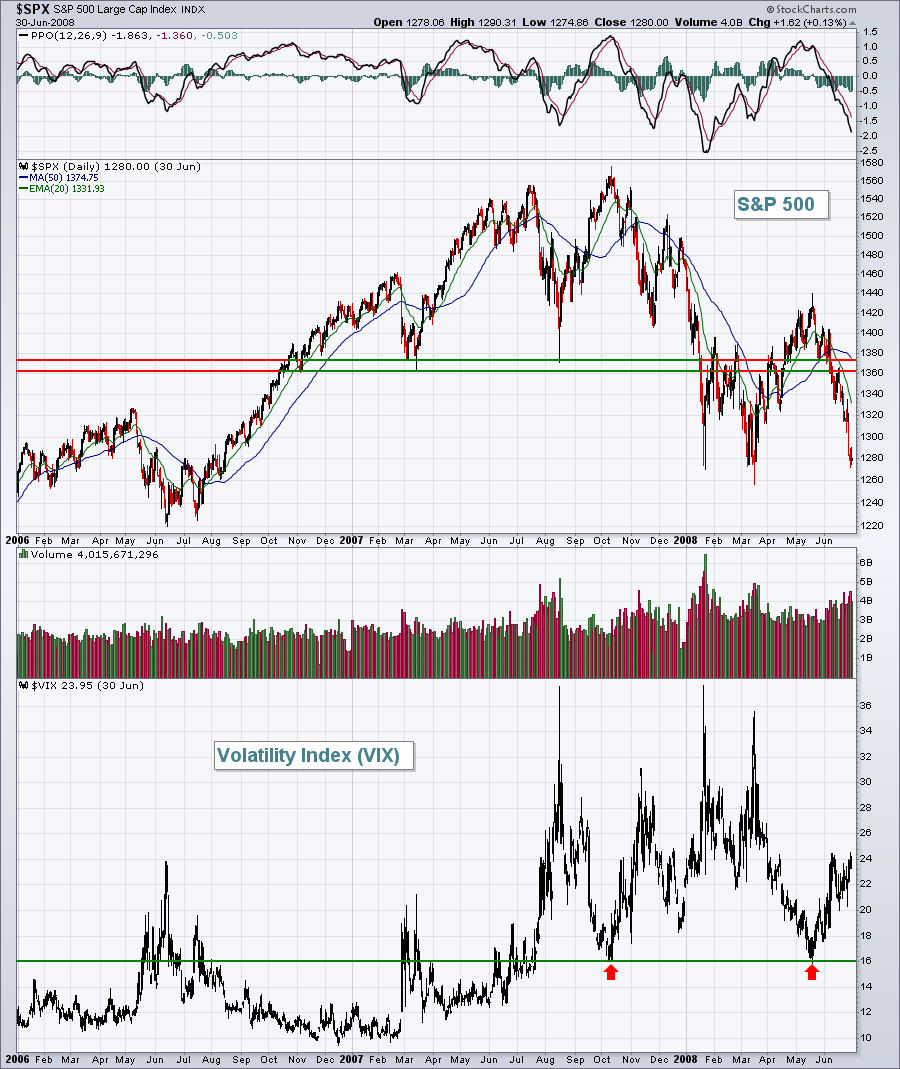 The breakdown in early 2008 began the series of lower highs and lower lows that are experienced during a bear market. Until that breakdown occurs, the prior series of higher highs and higher lows remain intact. That's why, for me, I need to see the confirmation or the bridge, if you will, from a correction to a bear market.
A correction and a bear market start from the exact same level - the bull market high - and in the same exact manner. There's no need for anyone to differentiate between the two because they both begin the same way with increasing volatility and panicked selloffs. It's what happens after the intial selloffs that determines what we're dealing with.
There are other signals that should be addressed, however. For instance, when the S&P 500 established its initial key price support in February 2018, so too did the Russell 2000 ($RUT), Dow Jones Transportation Average ($TRAN), Dow Jones U.S. Banks Index ($DJUSBK), among others. All three of these key indices have broken to new lows. Crude oil ($WTIC), a signal of global economic strength/weakness, has cratered, falling from $77 per barrel to $50 per barrel. Money has been rotating towards defensive areas of the market, with the latest warning sign there being the drop in 10 year treasury yields ($TNX) back beneath 3.00%. The TNX falls when treasury prices rise. Once we saw the drop in the TNX below 3.00%, relative strength in economically-sensitive areas like financials and transportation stocks crumbled. All of this "under the surface" action is quite different than it was in February 2018, which is why I've become much more concerned about this evolving into a bear market.
Could we still rally from here? Could this still be just a correction? Yes, I believe it could. But whereas I'd have given a 1% probability of a bear market in February 2018, I believe that probability is more like 90% now. The last missing piece is the S&P 500 breakdown below critical price support. In my view, that changes the game because it establishes the "lower high, lower low" mentality that drives bear markets.
I'm joining John Hopkins, President of EarningsBeats.com, for a 2019 Stock Market Outlook on Wednesday, December 19th at 4:30pm EST. There could be much more clarity with three more trading days next week under our belt and I'll be discussing the above along with a host of other topics as we brace for a brand new year!
Listen, I'm prepared for a bear market and I'm also prepared for a continuation of the decade-long bull market. I have both a Strong Earnings ChartList featuring companies that have recently beaten Wall Street consensus estimates and a Weak Earnings ChartList featuring companies that have missed the boat and disappointed Wall Street. I'll be discussing both and how to use them effectively at this upcoming webinar. The webinar is FREE, but you must register for the event. For more information, CLICK HERE. It'll be an in-depth look at what we can expect in 2019 so please plan to join me and John if you can!
Happy trading and happy holidays!!!
Tom
