Before I look ahead to what we might expect in 2019, let me rewind for a bit and check out last year's forecast. Here's a recap, summarizing a few of my "expectations". I've graded my predictions with a slight curve. Feel free to agree or disagree. :-)
(1) Reviewed both renewable energy ($DWCREE) and home construction ($DJUSHB), the two best industry performers in 2017. I evaluated both heading into 2018, but preferred the DWCREE and warned about losing the rising 20 week EMAs as that could signal a trend reversal. I mentioned that home construction had been rising parabolically and was "less likely to sustain this move throughout 2018". What really happened? Well, the strength in DWCREE did last longer, but eventually both groups lost their 20 week EMAs and continue to trade beneath them. Check out the rapid decline in the DJUSHB shortly after my 2018 forecast:
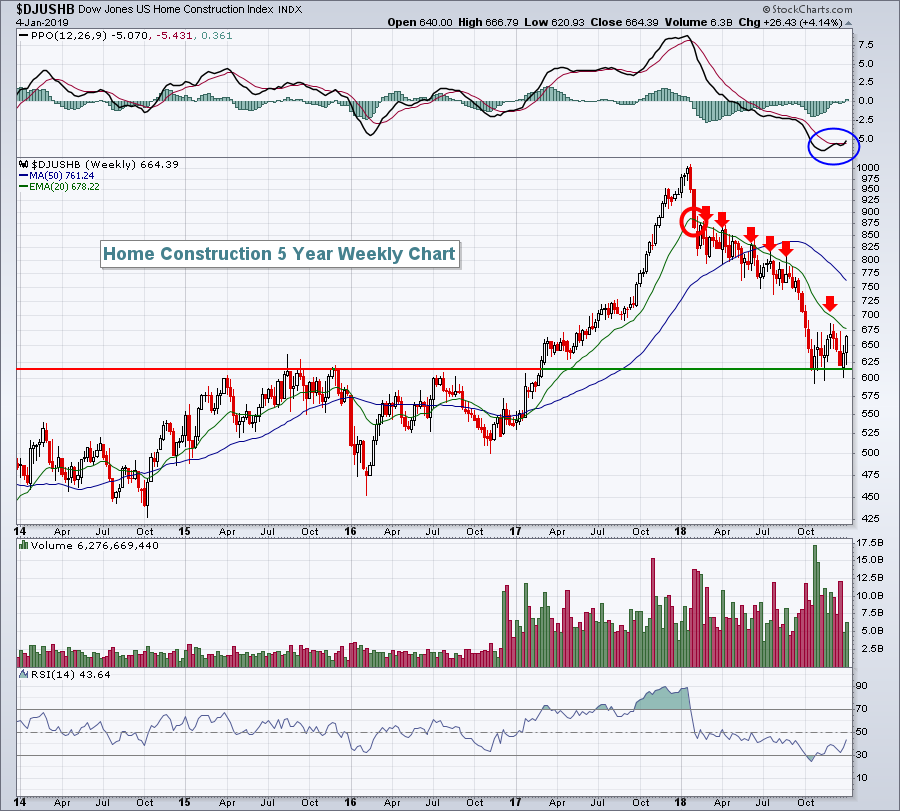 Looking back now, it's pretty simple to see that the DJUSHB was rising in unsustainable, parabolic fashion. After losing its 20 week EMA support in early February 2018 (red circle), it trended beneath its 20 week EMA and is still beneath it. Capturing profits at the time of the reversal would have saved a bundle! The DWCREE did outperform the DJUSHB as expected, rising to new highs in May 2018 before faltering and losing its 20 week EMA. Knowing when to exit a trade is generally more important than knowing when to enter one.
Prediction Grade: A-
(2) "I believe 2018 will be a strong year for consumer stocks." I provided 4 industry groups in the consumer space that I liked heading into 2018 - broadcasting & entertainment ($DJUSBC), auto parts ($DJUSAT), footwear ($DJUSFT), and brewers ($DJUSDB). The idea behind this forecast was that consumer discretionary (XLY) had consolidated for two years relative to the S&P 500, but broke out heading into 2018, providing tailwinds just as we entered the year. Here's a relative chart that should help to illustrate my point:
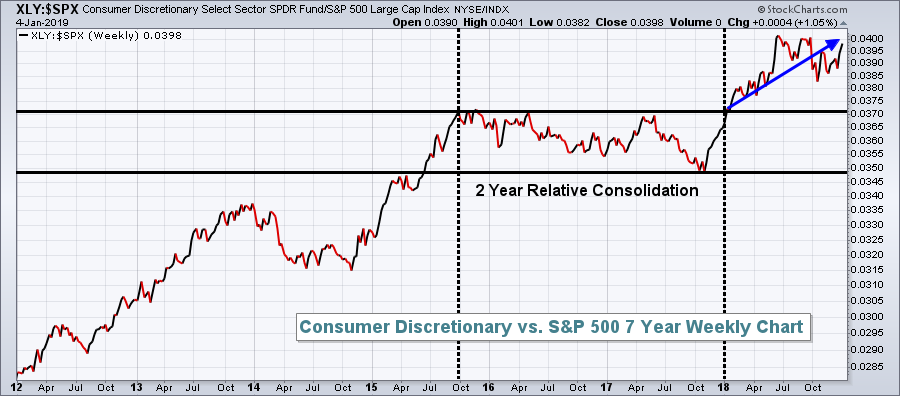 Consumer discretionary trailed only utilities (XLU) and healthcare (XLV) in terms of performance since my 2018 Stock Market Forecast article. It easily outpaced the benchmark S&P 500 and the other aggressive sectors.
Prediction Grade: A
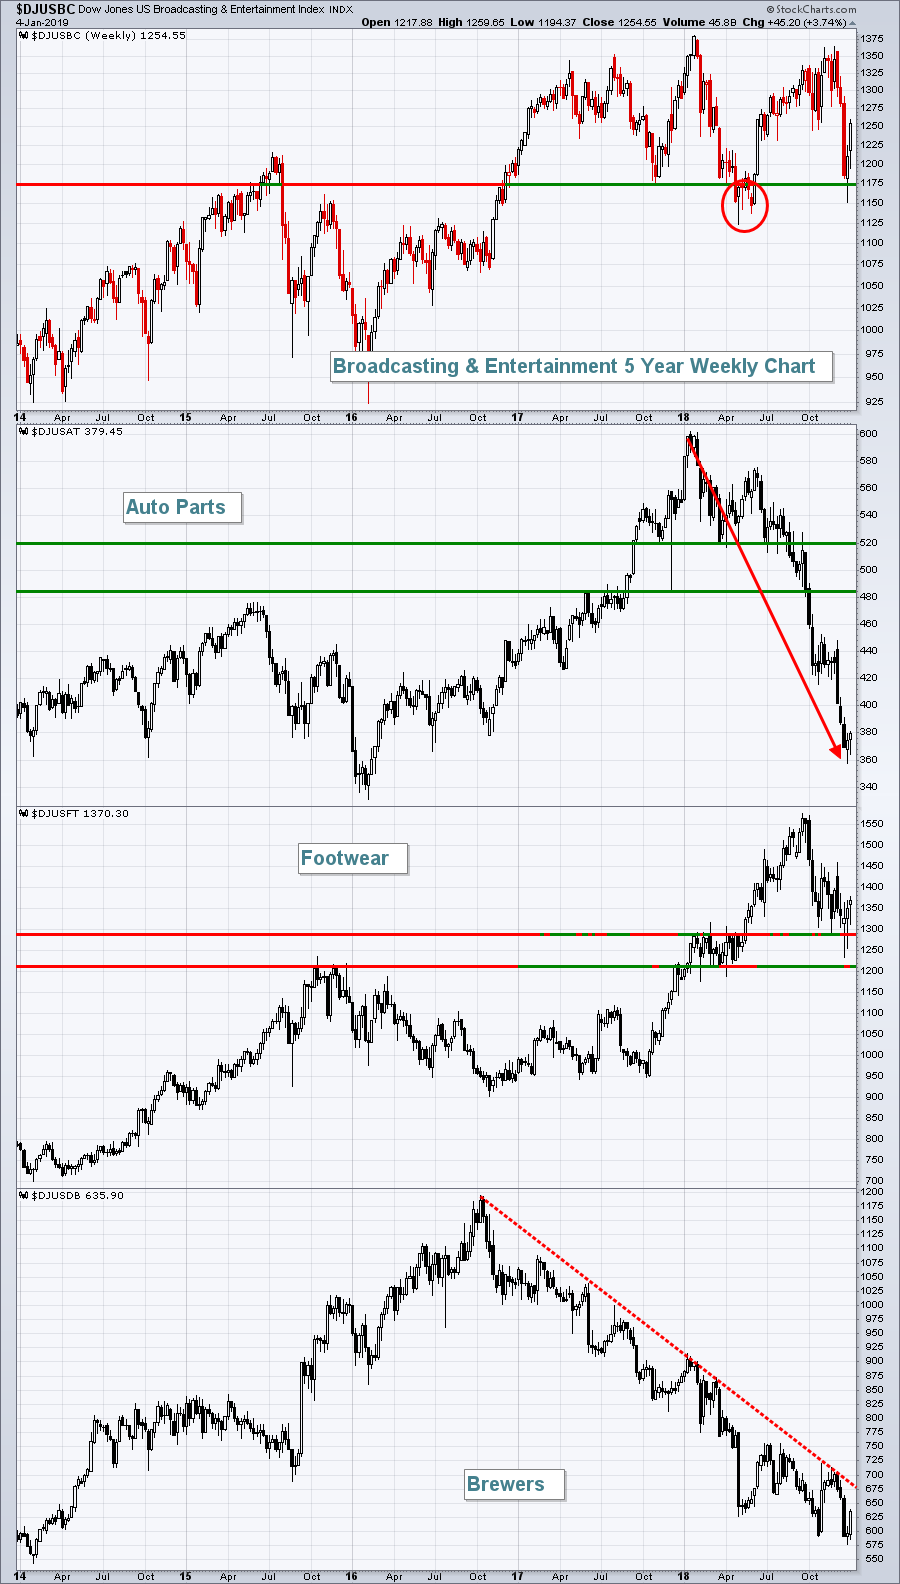
As mentioned above, I favored the following 4 consumer industry groups: DJUSBC, DJUSAT, DJUSFT, DJUSDB. Here's the long-term weekly chart for each:
 Let's take these one at a time.
(3) DJUSBC - this is the hardest prediction to grade as the group underperformed in the first half of the year and outperformed during the second half. The price breakdown in Q2 (red circle) was rough, but the solid recovery into mid-Q4, a time in which the overall market had already begun to roll over, was impressive. The industry was part of a strong sector and did manage to outperform the S&P 500, so I'll be kind.
Prediction Grade: B-
(4) DJUSAT - Outside of bouncing off price support to begin Q2, auto parts was a disappointment. The second half of 2018 was a disaster. Do I really need to discuss that chart any further? The only thing keeping this grade from being an F is that I award points for participation. Hey, it's my grading scale! :-)
Prediction Grade: D-
(5) DJUSFT - Outstanding group in 2018. Not only was footwear a part of the strong consumer discretionary sector, but it also was one of its strongest components. While Q4 was weak for footwear, how many industry groups were strong? One word of caution, however. Like so many areas of the stock market, the DJUSFT lost key support levels over the past few months. In particular, it's now trading beneath its declining 20 week EMA. You saw what happened to home construction in 2018 when it lost its rising 20 week EMA support. Be careful in 2019.
Prediction Grade: A+
(6) DJUSDB - Brewers represented an area of the stock market that had been downtrending in 2017, but was still in a longer-term uptrend. I pointed out last year that I was waiting for the shorter-term down channel to break as that would likely represent a change of character on the chart and a longer-term reversal to the upside. As you can see from the above chart, this "reversal" never occurred and the DJUSDB continues to trend lower as we enter 2019. Because the buy signal never flashed, it was a nice call to simply avoid the group as it was an extremely weak performer in 2018.
Prediction Grade: B
All in all, I believe the 2018 Forecast was a pretty good one. Unfortunately, one really bad grade kept me off the Honor Roll. Oh well, that leaves me something to shoot for in 2019, right?
"You're only as good as your last call......what might we expect in 2019?"
First, we've entered a cyclical bear market. When I'm trading and there's a debate about "is this a correction or is this a bear market?", I honestly don't care. Call it whatever you want. The beginning of both looks exactly the same. We see panicked and impulsive selloffs with a VIX spiraling higher. The difference between the two is that a correction never experiences the lower highs and lower lows on a longer-term weekly chart. Once that support levy breaks, we transition into a bear market. At that point, my trading strategy changes as I will short into strength as we near overhead resistance. Bear markets print lower highs and lower lows. Resistance acts like a steel wall and support will break. That's opposite of what we grow used to in a bull market. When a bear market arrives, you must change your approach to the market, whether a trader or a long-term investor. Bear markets will drain you financially and emotionally. Here's the chart that illustrates the December 2018 breakdown and transition from "correction" to "bear market":
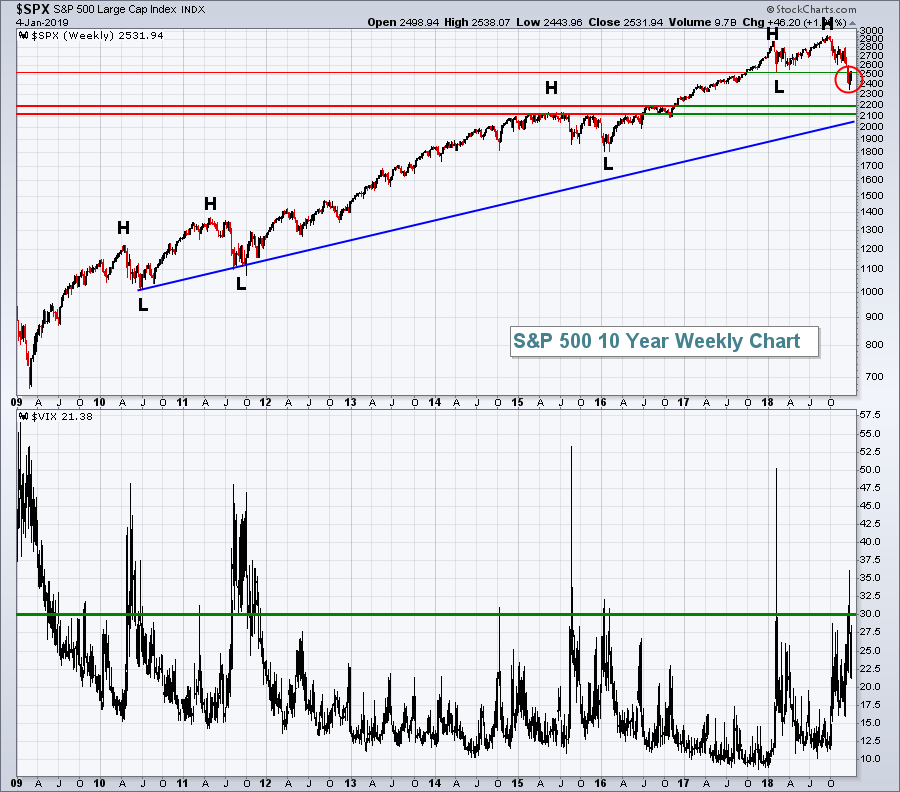 I believe the price support breakdown beneath the early-February 2018 low transitioned us from correction to bear market. I suspect that 2019 will be very challenging. There will be periods of strength (ie, short-term uptrends), followed by panicked episodes of selling to establish at least one more low beneath the December 2018 low. Here are specific "big picture" predictions for 2019:
(1) We have entered a cyclical bear market within a secular bull market. I believe we will experience tremendously higher equity prices over the next decade, but there will be hiccups along the way. One look at the following chart will help to illustrate why I believe the future remains very exciting for stock traders and investors:
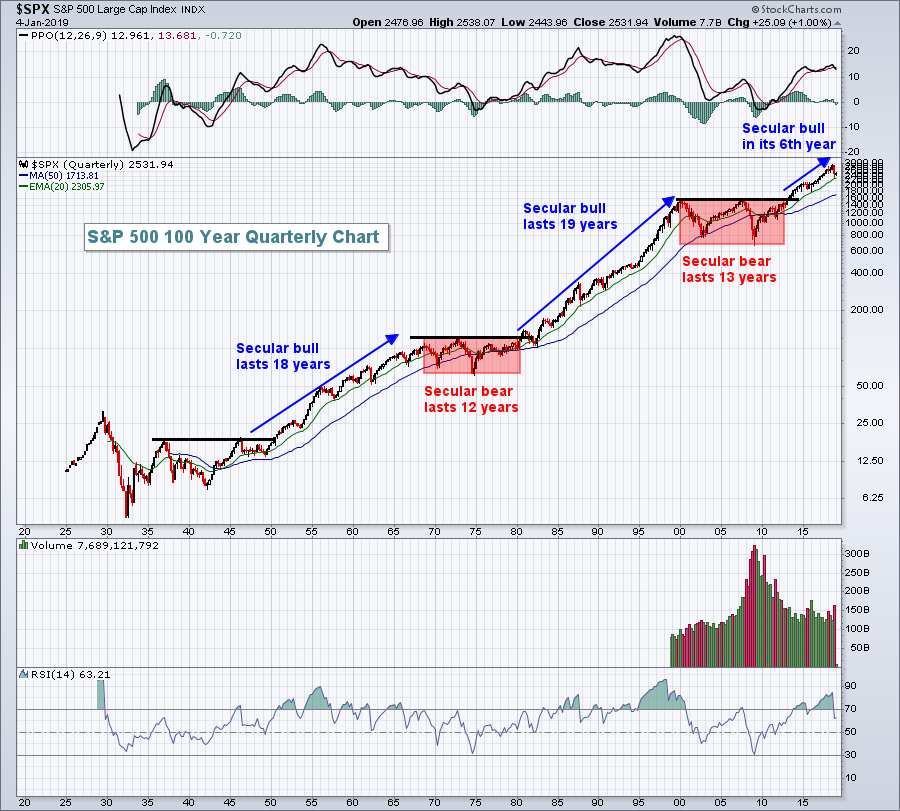 Do not ever lose sight of the above chart and the secular bull market that we're in (my opinion). Why? Because cyclical bear markets can be very fast and to a much lesser degree than secular bear markets. It's entirely possible that we quickly resume the overall secular bull market uptrend much faster than many believe possible.
(2) This bear market will be short-lived. Cyclical bear markets tend to end quickly and they're not nearly as deep as their secular bear market counterparts. Since 1945, bear markets within secular bears have on average lasted 632 days, or roughly 21 months, dropping 43.92%. Bear markets within secular bulls have on average lasted just 284 days, or 9-10 months, less than half that of a bear market within a secular bear and have fallen 25.73% on average. Knowing the difference clearly can pay huge dividends. I will be looking for a cyclical bear market bottom to form in the June-September timeframe and an explosive Q4 rally to follow. I do not believe we'll see a low beneath 2100 on the S&P 500. 2200 could mark the bottom.
(3) Sentiment will help to guide us in 2019. Bear markets are emotional and many times pay little attention to price, trendline and moving average support. The last two bear markets never saw a VIX reading move below 16. Therefore, if the VIX drops beneath 16 during 2019, at least consider the possibility the bear market has ended. A bear market requires fear. If fear dissolves, so too will the bear market.
I understand the above forecast is much more big picture without specific sector or industry predictions, but keep in mind that bear markets can be extremely unpredictable and preserving capital will be my primary focus, not trying to guess which area will outperform or underperform. While I'm not normally a fan of gold ($GOLD), I do believe the yellow metal will be a nice hedge - at least during the first half of 2019.
Please subscribe to my blogs. They're 100% FREE! You can subscribe to my ChartWatchers blog by scrolling to the bottom of this article and typing in your email address in the space provided and then clicking the green SUBSCRIBE button. My "Trading Places with Tom Bowley" blog will provide you daily articles (published just before the stock market opens each day) to keep you technically informed of the things that matter most. A recent article that discussed sentiment (VIX) to help me realize a major bottom had formed was published on December 27, 2018 and titled "Support Has Been Established, Now How High Might We Bounce?" You can subscribe to my Trading Places blog at the bottom of that article in the same fashion described here. As always, I really appreciate your support. I'll do my best to guide you through a challenging 2019!
If you'd like to send me a response or offer up your agreement/disagreement with the above, or just to comment about my blog content in general, feel free. My email is tomb@stockcharts.com and I'd love to hear from you.
I want to wish everyone a very happy new year! To health, happiness and prosperity for all!
Cheers!
Tom
