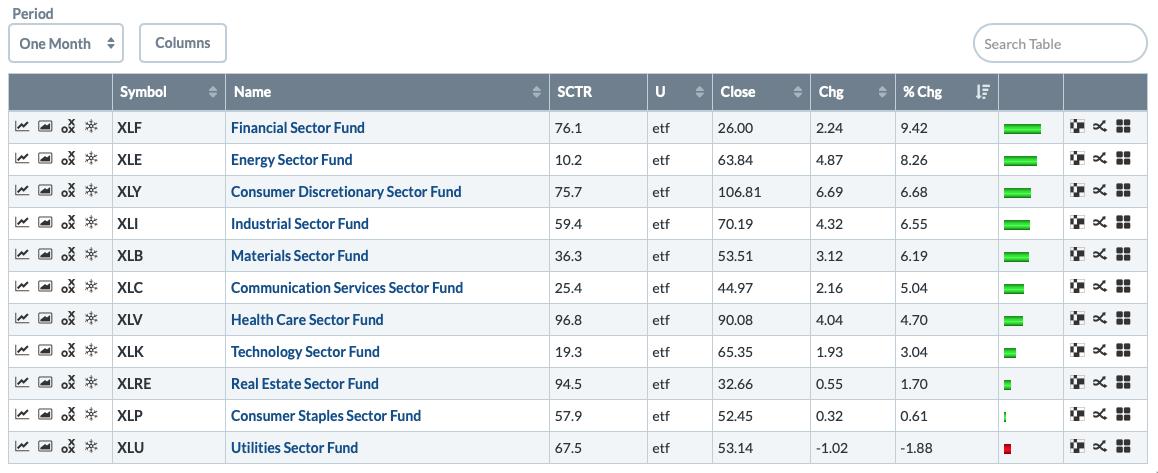
Sector rotation continues to favor the defensive sectors of Health Care, Consumer Staples, Real Estate and Utilities. Some of the more aggressive sectors are perking up now, with Financials actually making the biggest gain of the past month. Utilities in that same timeframe haven't done so much, but, in the short term, they are starting to look bullish.
Here's the Sector Summary for the past month. Financials are beginning to lead, which is positive, but technology could use a boost.
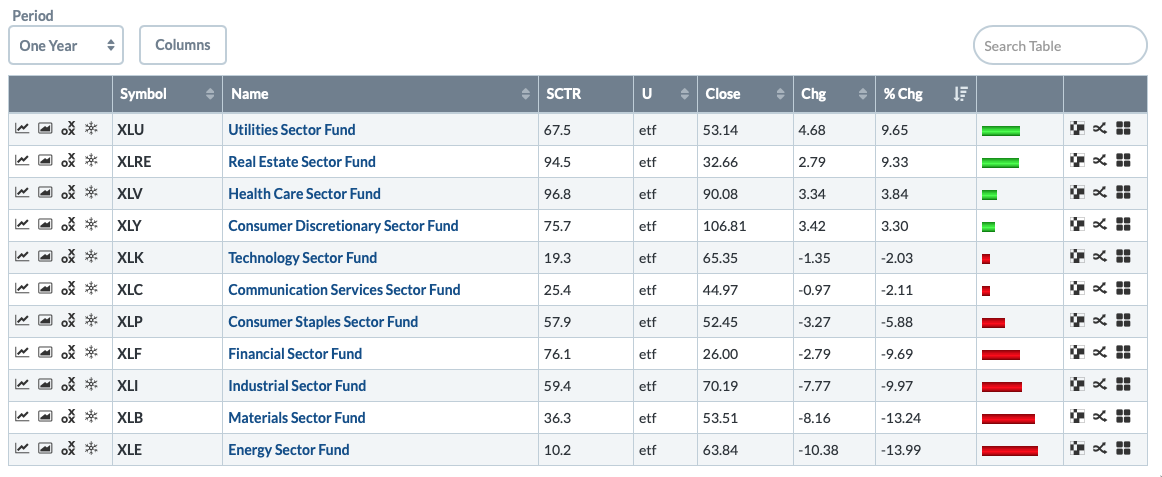
In the past year, the clear "winners" have been the defensive sectors, along with the interesting addition of Consumer Discretionary.
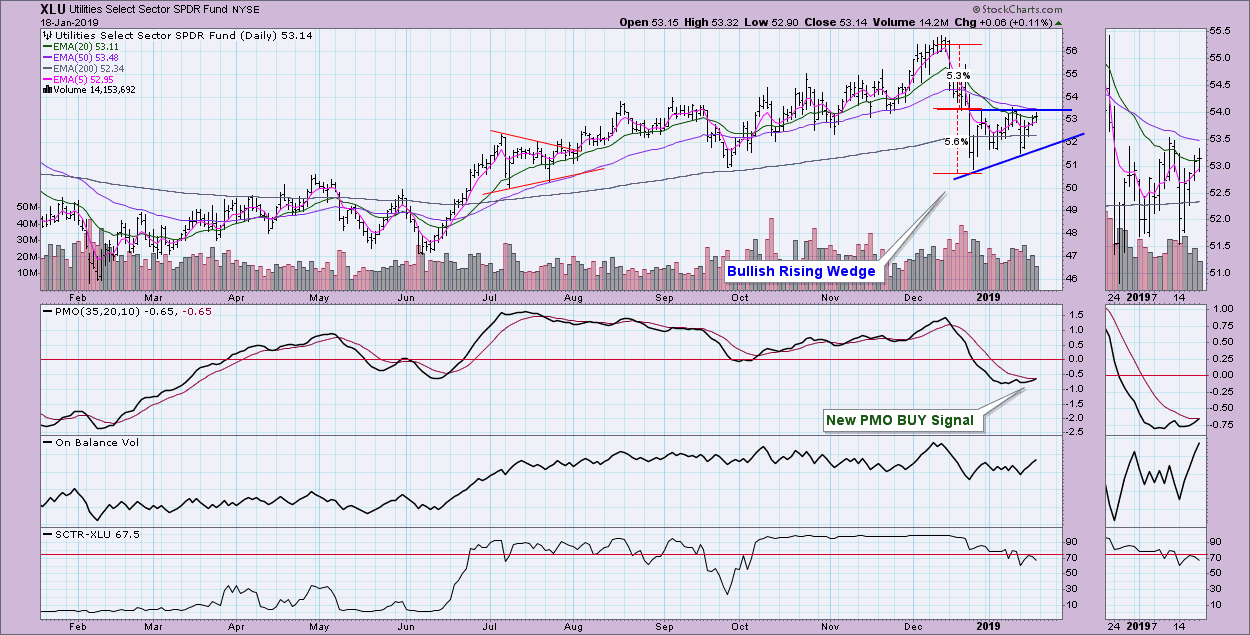
In the short term, XLU looks promising. We have a new oversold PMO BUY signal and a bullish ascending triangle. Carl and I noted in Friday's DecisionPoint show that seeing a PMO bottom below the signal line does make this new BUY signal a little suspect. We've found that "clean" crossovers with little hesitation tend to be the most successful. Price is nearing resistance once again at $53.50. We will need to see a breakout in order to confirm this pattern, but if it is confirmed, that would suggest that the measured price target will be near the December high. If it fails at this level, it could be in for another test of the rising bottoms trend line.
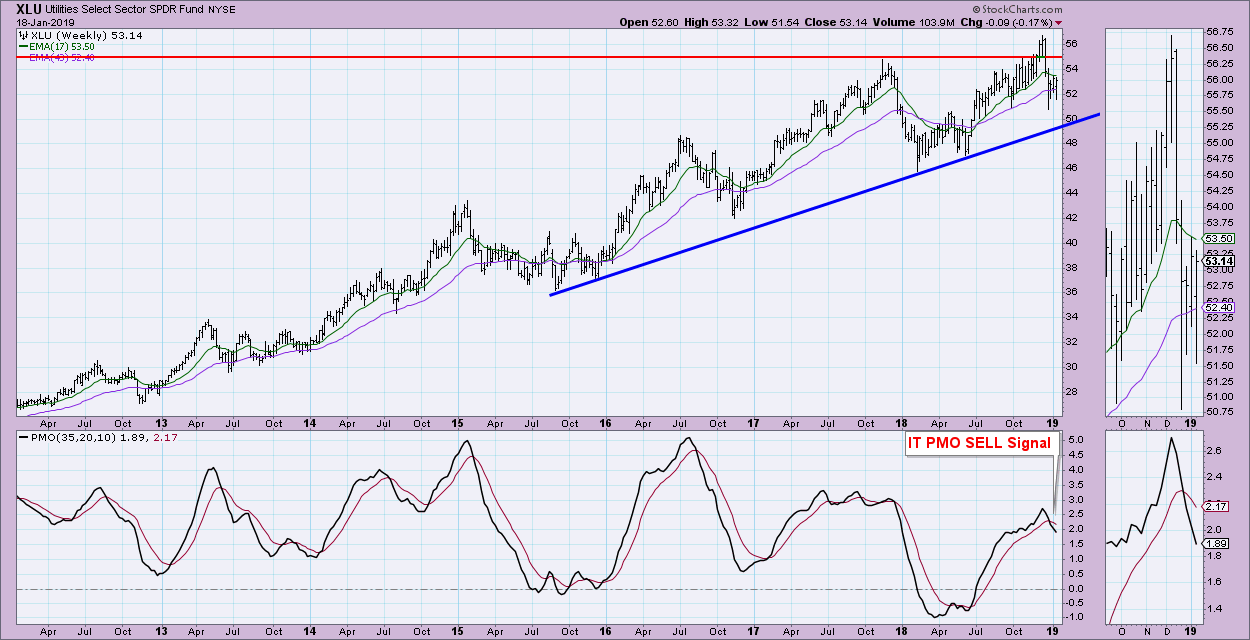
The weekly chart shows the rising trend intact, but price is also vulnerable to a drop to test it again. The IT PMO SELL signal could be an attention flag.
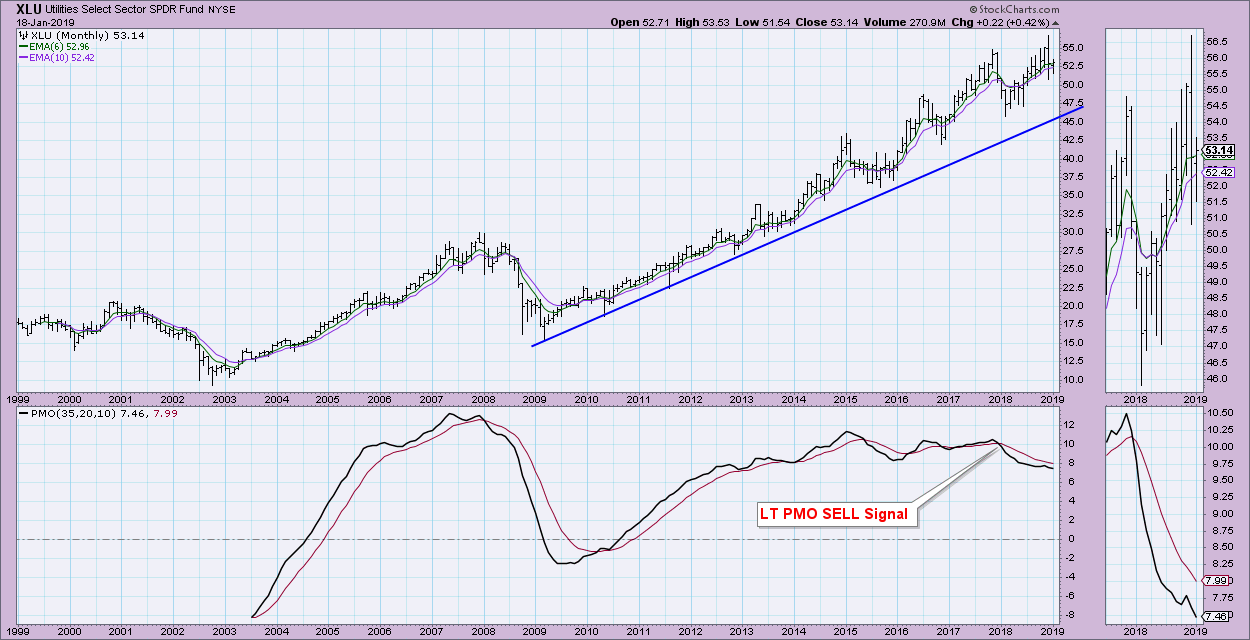
The rising trend is intact on the monthly chart, but the monthly PMO is holding onto a PMO SELL signal and, in fact, failed to procure a BUY signal. Tops below the signal line add to the bearishness on the chart.
Conclusion: The new PMO BUY signal has appeared on the daily chart just in time to execute an ascending triangle. However, the signal is a bit suspect, given the reluctance of the PMO to execute it, and the longer-term charts aren't particularly positive. My conclusion? We may have to test the bottom of the triangle one more time given the bearish longer-term charts. If we get the breakout, I would look for a test of the all-time highs.
Watch the latest episode of DecisionPoint with Carl & Erin Swenlin - LIVE on Fridays at StockCharts TV (4:30pm EST) or on the StockCharts TV YouTube channel here!
Technical Analysis is a windsock, not a crystal ball.
Happy Charting!
- Erin
Helpful DecisionPoint Links:
DecisionPoint Shared ChartList and DecisionPoint Chart Gallery
Price Momentum Oscillator (PMO)
Swenlin Trading Oscillators (STO-B and STO-V)
**Don't miss DecisionPoint Commentary! Add your email below to be notified of new updates"**
