ChartWatchers March 16, 2019 at 03:55 PM
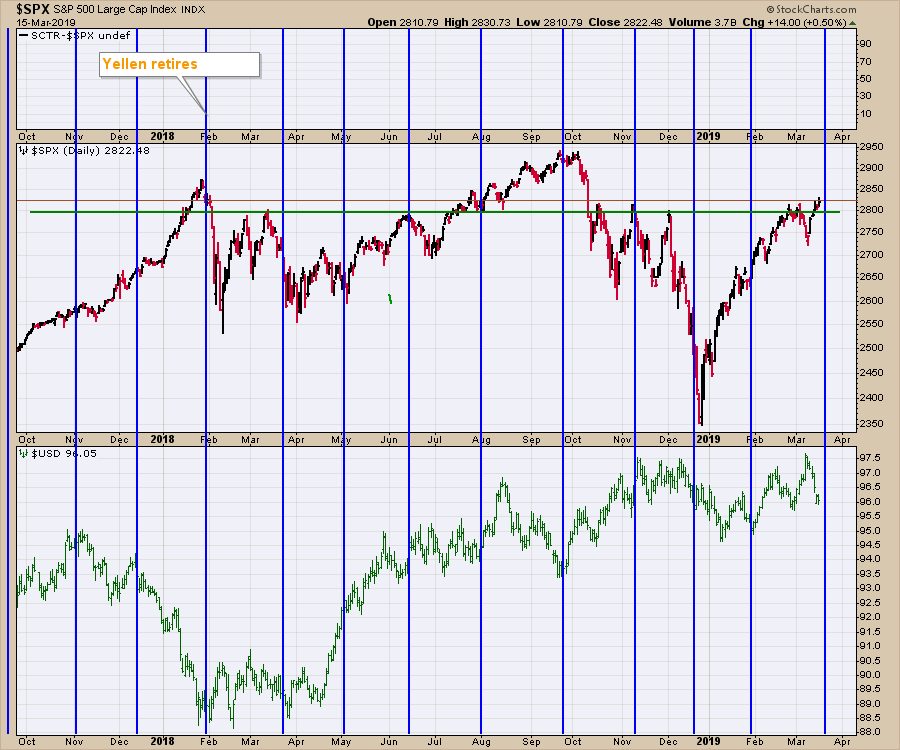
As always, next week's Fed meeting will be closely watched, with chartists in particular watching it uniquely. On the chart below, the blue lines represent Federal Reserve meeting dates. Friday marked a test of the 2823 level on the $SPX... Read More
ChartWatchers March 16, 2019 at 12:51 PM
In a sense, it already has. Well, maybe not 16 straight years, but play along. I've done a lot of historical stock market research over the years and several patterns really stand out. But one in particular always keeps me on edge as a short-term trader... Read More
ChartWatchers March 16, 2019 at 08:39 AM
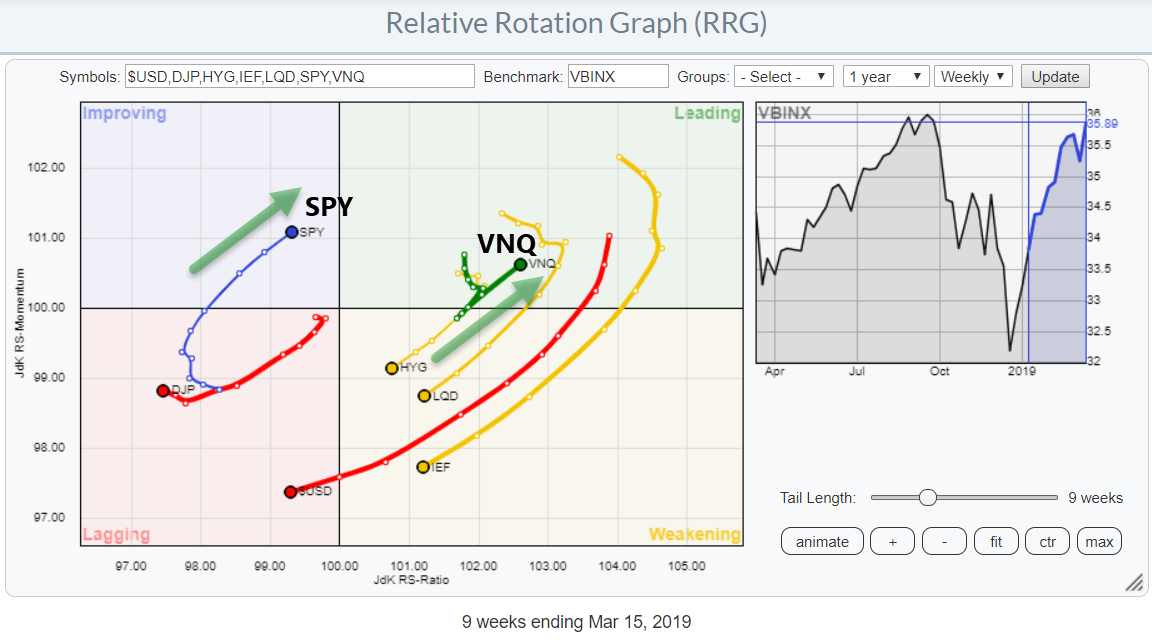
This Relative Rotation Graph shows the rotation for asset classes over the past 9 weeks. The main observation is that fixed income related asset classes are all inside weakening and heading, rapidly, towards lagging. SPY (stocks) is close to returning into the leading quadrant... Read More
ChartWatchers March 16, 2019 at 04:37 AM

Anyone recognize these two phones? A good old indestructible Nokia candy bar was the first phone for many of us. I had a few Nokia cellphones over the years and they always worked great, back in the day... Read More
ChartWatchers March 16, 2019 at 12:00 AM
Editor's Note: This article was originally published in John Murphy's Market Message on Friday, March 15th at 2:58pm ET... Read More
ChartWatchers March 16, 2019 at 12:00 AM
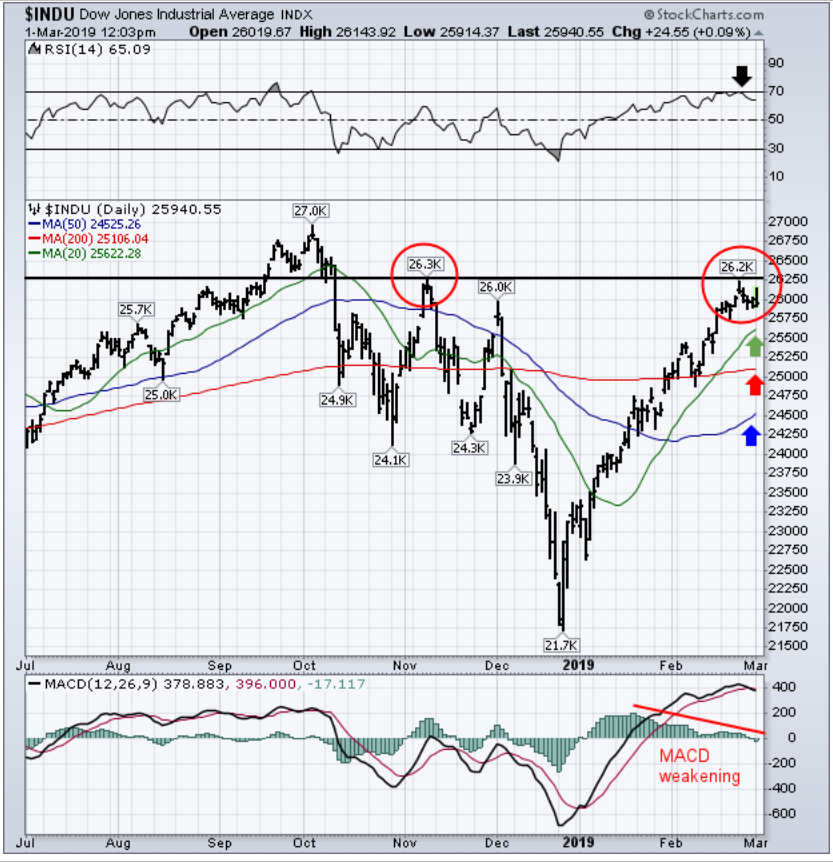
I have a chart at the bottom of this article that will explain my moving out of the bear market camp. Yes, it is delayed, but, as I explained before the December crash, I'd rather miss a bottom and rally than be hanging on for dear life during a quick and painful decline... Read More
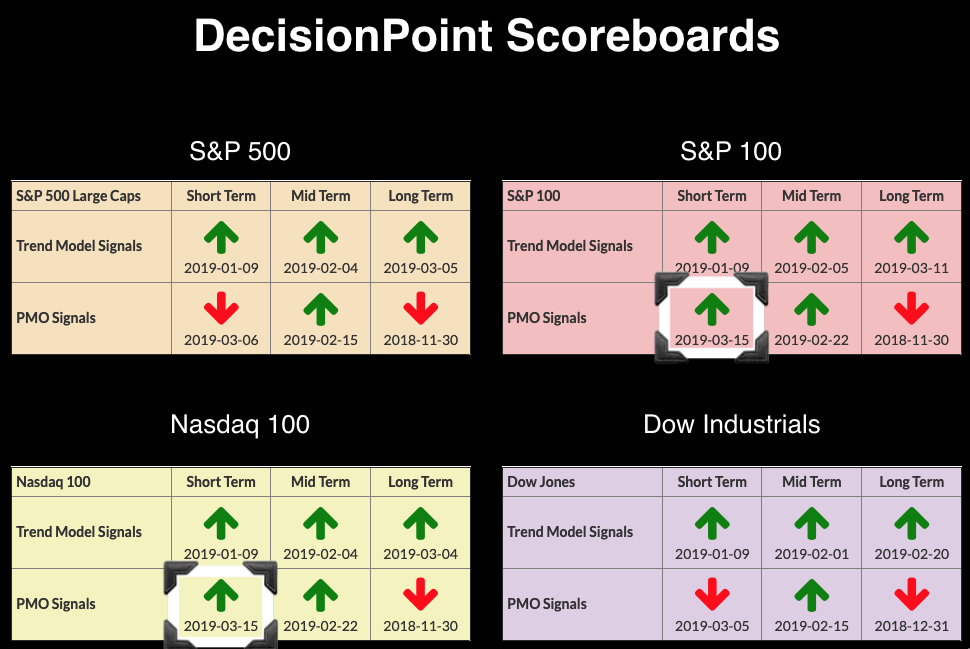
ChartWatchers March 15, 2019 at 05:15 PM
The S&P is pretty much at the same level it was back in October of last year. However, it still remains well below its all-time high of 2939, which was also achieved in October of last year... Read More
ChartWatchers March 02, 2019 at 05:10 PM
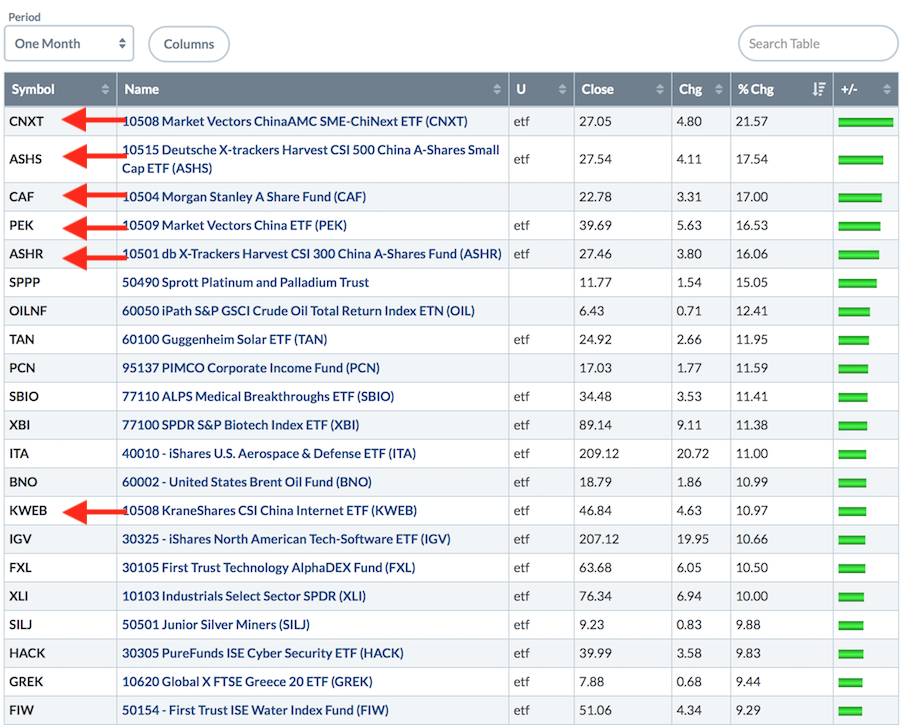
As we look at the strongest ETFs for February, you'll notice how Chinese-related ETFs have soared of late, as shown in the list below. Commodity-related ETFs also did very well, as did the technology-related industry groups... Read More
ChartWatchers March 02, 2019 at 08:13 AM
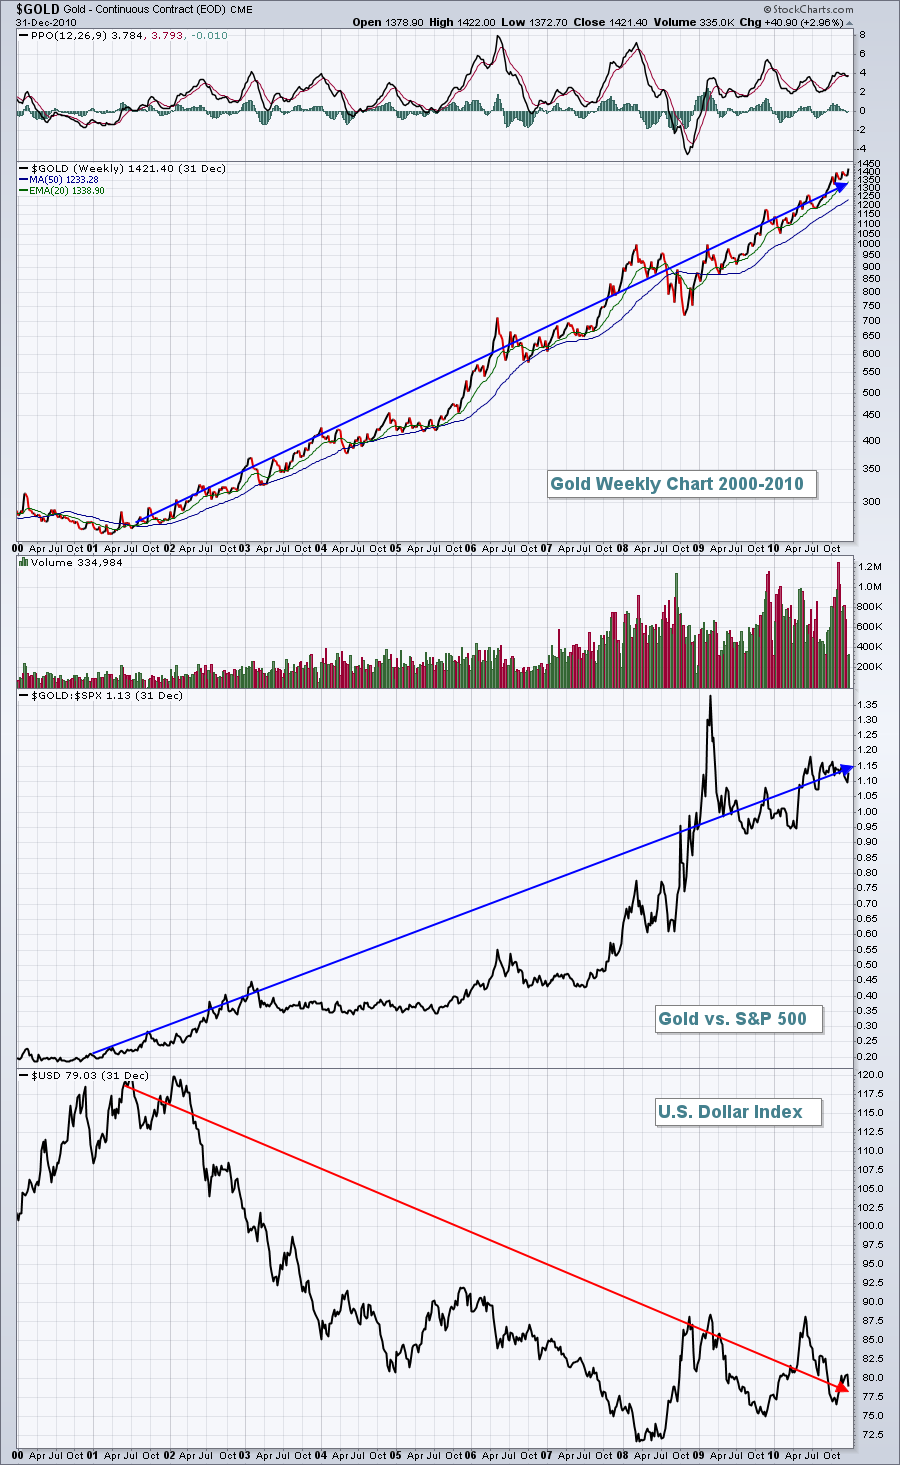
Gold ($GOLD) performs its best in a falling U.S. Dollar ($USD) environment. There is a solid inverse relationship between the direction of GOLD and the direction of the USD that has existed for decades... Read More
ChartWatchers March 02, 2019 at 05:51 AM
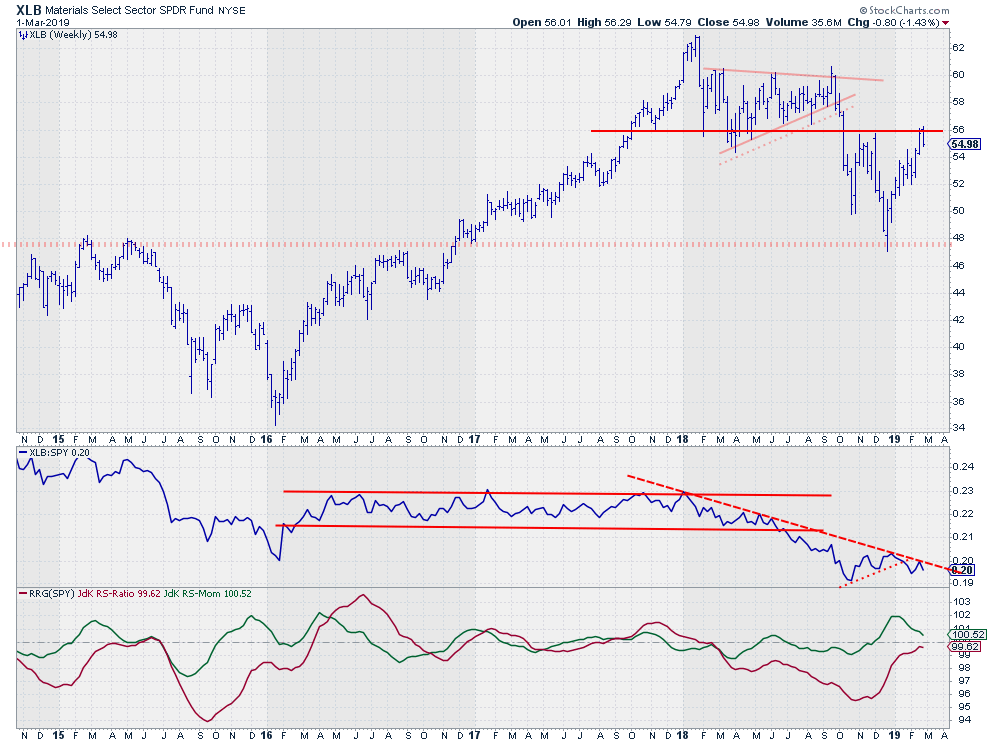
The Materials sector, XLB, is testing overhead resistance around $56. This is the level where lows have been formed in 2017 and 2018 as well as two important highs at the end of 2018... Read More
ChartWatchers March 02, 2019 at 05:29 AM

We are all well aware of the S&P 500 and the 200-day moving average, but how well does this moving average work for broad market timing? Pretty well, it turns out, but only on the long side... Read More
ChartWatchers March 02, 2019 at 12:00 AM
Editor's Note: This article was originally published in John Murphy's Market Message on Friday, March 1st at 11:55am ET... Read More
ChartWatchers March 02, 2019 at 12:00 AM
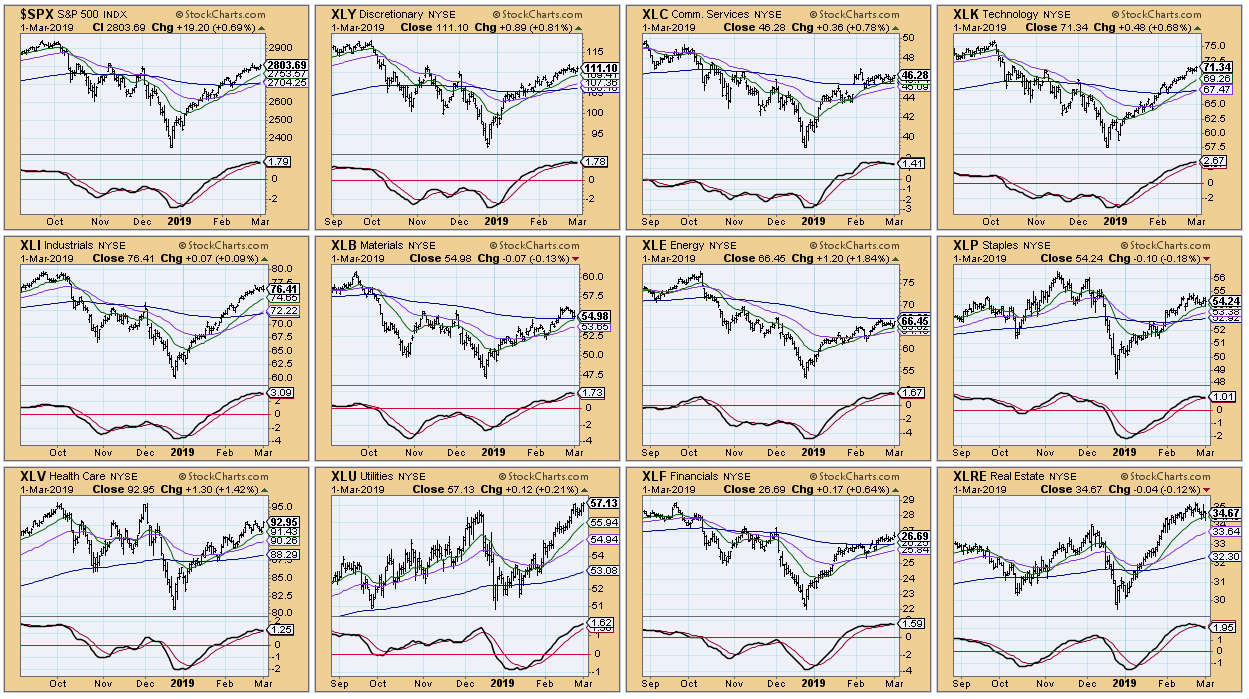
While comparing the relative performance of the OEX, IJH and IWM to the SPX, I found an attention flag. The market is very overbought, with momentum indicators rolling over in overbought territory. The same thing goes for all the sectors... Read More
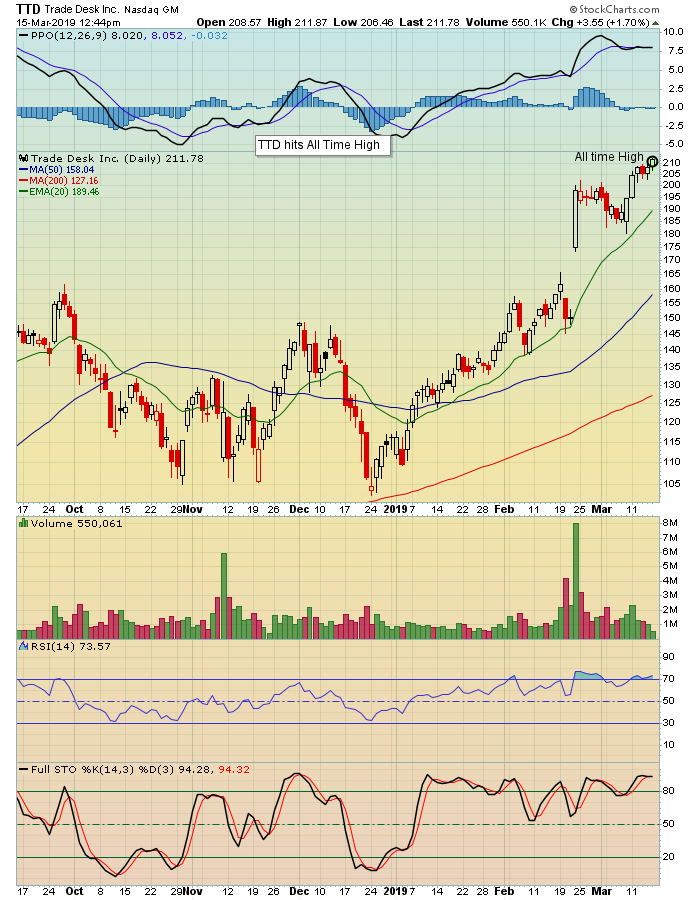
ChartWatchers March 01, 2019 at 08:25 PM
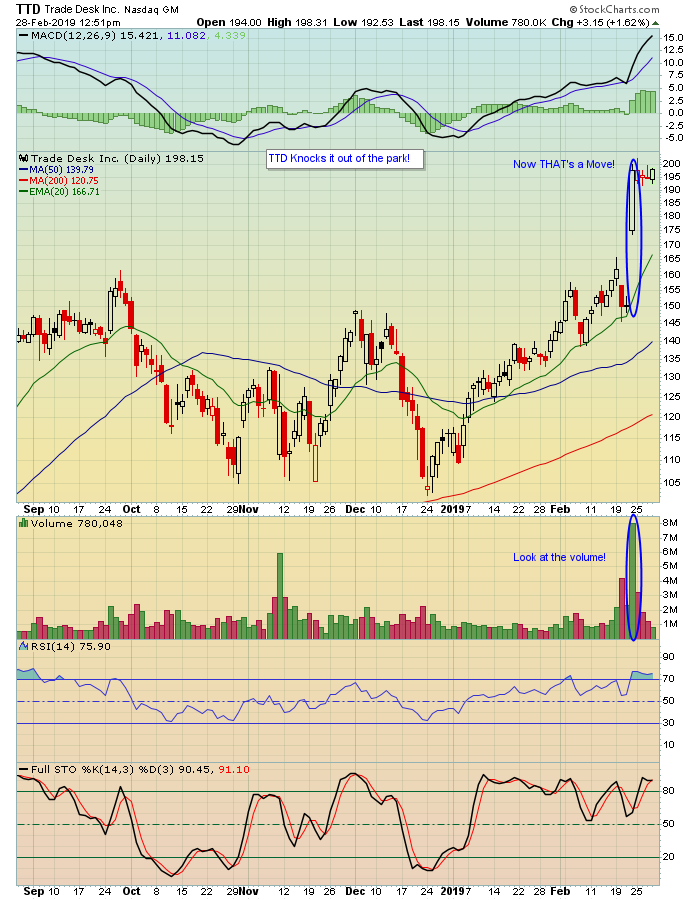
SO MANY stocks that recently reported earnings beat expectations and gapped up sharply on very strong volume after their results were released. Those stocks include OLED, TTD, W and PANW, among others... Read More