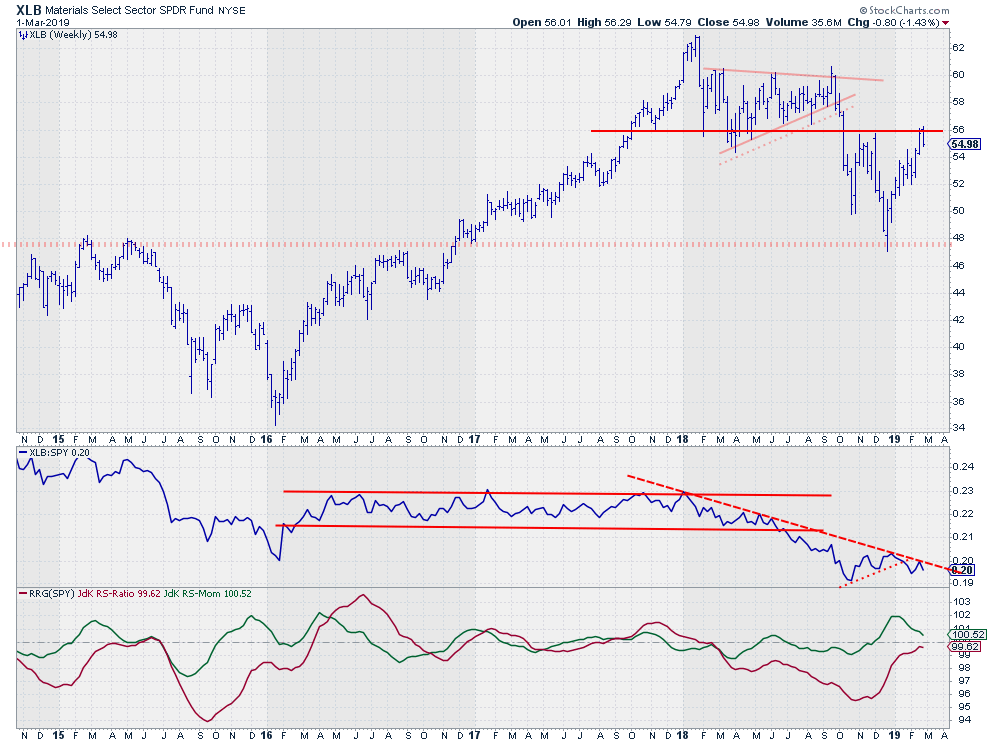
 The Materials sector, XLB, is testing overhead resistance around $56. This is the level where lows have been formed in 2017 and 2018 as well as two important highs at the end of 2018. For the time being, the attempt to break is failing, and this is visible on both the daily and the weekly charts.
The relative strength for XLB against SPY is in a solid downtrend since the start of 2018, and without a break higher on the price chart, it is hard to see how this can improve at short notice.
A Relative Rotation Graph can help to put things into perspective and shed some light on the "Big Picture" as it shows the relative movement, rotation, for all sectors that, together, make up the S&P 500 index.
Materials On A Relative Rotation Graph
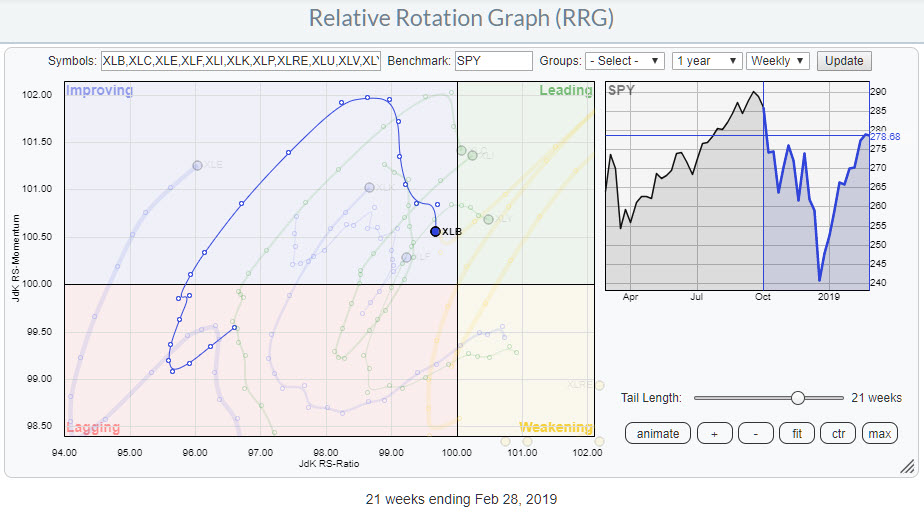 The chart above shows the weekly rotation for the Materials sector, XLB, within the universe of US sectors against SPY. After the tail turned upward inside the lagging quadrant, XLB kept up with the performance of SPY and moderately outperformed the market until the sector started to lose relative momentum again in the week of 21 Jan and 28 Jan when the tail started to roll over downward again without having reached the leading quadrant.
This loss of relative momentum, declining Jdk RS-Momentum, is still ongoing and pointing the tail on XLB towards the lagging quadrant again.
Assuming a normal clockwise rotation, the sector can be expected to return towards and into the lagging quadrant in the weeks to come.
The Daily Rotation
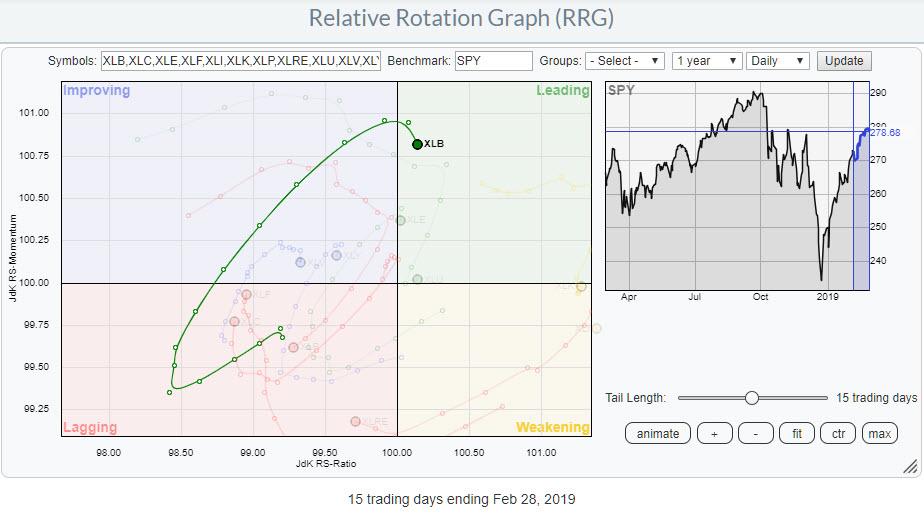 On the daily Relative Rotation Graph, the curve looks very similar to the weekly image. The only difference here is that XLB has just crossed into the leading quadrant.
In general crossovers from improving into leading are positive, especially when they occur backed by strong relative momentum. I.E., also rising on the JdK RS-Momentum scale.
That is not happening here. The crossover from improving into leading on the daily RRG happened while RS-Momentum already started to decline. It seems that there is not enough fuel left to push the XLB-tail deep(er) into the leading quadrant.
This combination of rotations on the daily and the weekly RRGs suggest underperformance for the Materials sector in the coming weeks.
A more extensive article on XLB, including a look at some individual stocks in the Materials sector, was published last Friday (3/1) in the RRG blog.
If you are in the New York area 10-12 March, please stop by and Join me at the TradersEXPO
My regular blog is the RRG blog If you would like to receive a notification when a new article is published there, simply "Subscribe" with your email address using the form below.
Julius de Kempenaer | RRG Research
RRG, Relative Rotation Graphs, JdK RS-Ratio, and JdK RS-Momentum are registered TradeMarks ®; of RRG Research
Follow RRG Research on social media:
Feedback, comments or questions are welcome at Juliusdk@stockcharts.com. I cannot promise to respond to each and every message but I will certainly read them and where reasonably possible use the feedback and comments or answer questions.
If you want to discuss RRG with me on SCAN, please use my handle Julius_RRG so that I will get a notification.
