Have you ever played devil’s advocate in a group discussion? That's the situation where everyone comes to one conclusion, so you take the opposite side just to provide an alternative hypothesis and argue its merits.
We often avoid this sort of “outside the box” thinking because of confirmation bias. Once we’ve decided we’re bearish, we assign greater importance to any new bearish evidence because it supports our predetermined thesis.
One way to combat this is to play devil’s advocate with your own process. Once you’ve drawn a conclusion, force yourself to take the opposite side of the argument. What would need to happen to make your thesis completely incorrect?
To be clear, I’m overall bearish on US equities here. I’m not “the world is ending” bearish, but I’m more in the “I just can’t see much further upside from here” camp. I wouldn’t be surprised if we end the year within 5% of where we’re at right now.
But what if stocks go dramatically higher from here? What would have to happen for my flat-to-down thesis to be incorrect?
This idea came to me when I looked at a daily chart of the Dow after the close on Friday, shown below:
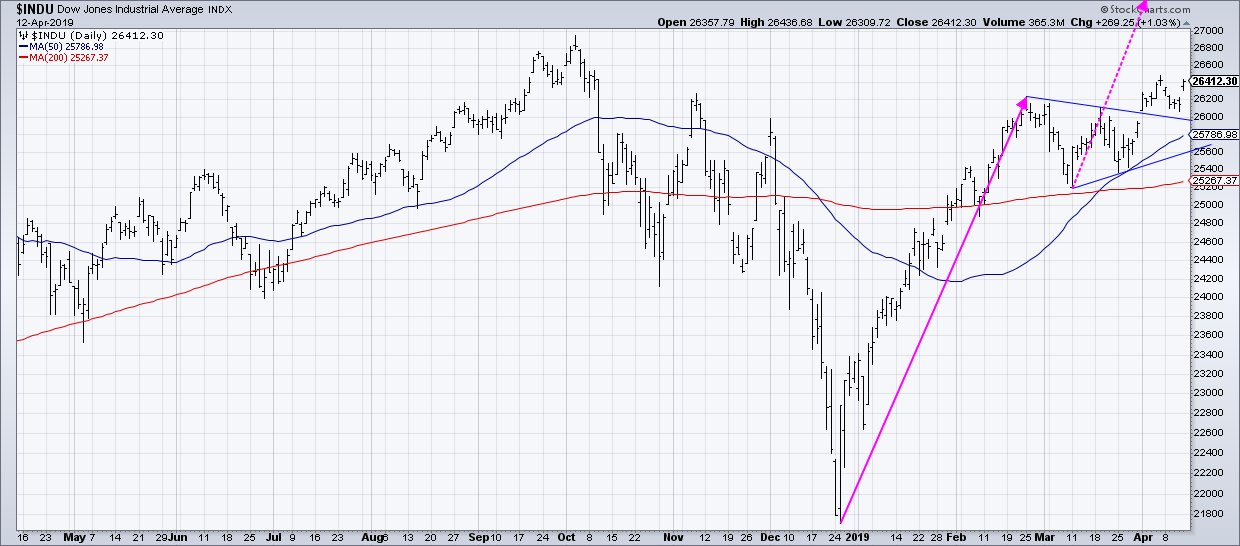 I decided that the month of March looks like a pretty classic pennant pattern: a long uptrend followed by a short-term consolidation with lower highs and higher lows.
If that was a pennant, which resolved to the upside the first week in April, then what would the upside target be for the Dow? Based on the length of the flagpole, that would mean an upside objective of 30,466, about 15% higher than current levels. Take a similar measurement on the S&P 500 (which did not have a pennant, but you figure if the Dow goes up that much, then it's fair to say the S&P could go up a similar amount) and that gives you a target of 3265.
Wow.
So what would we need to see for the market to get to that level? Here’s a laundry list of bullish tells that would have to persist for quite a while:
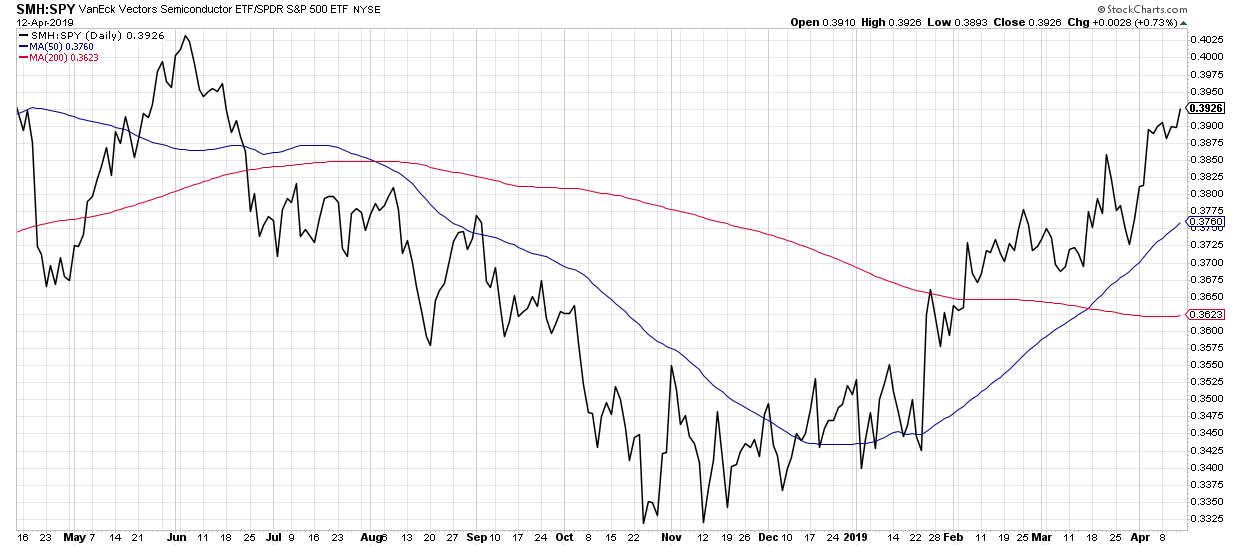
1. Technology, and especially semiconductors, would have to remain leadership. However, it's highly unlikely that the market could move that far without semis being a big part of the upside.
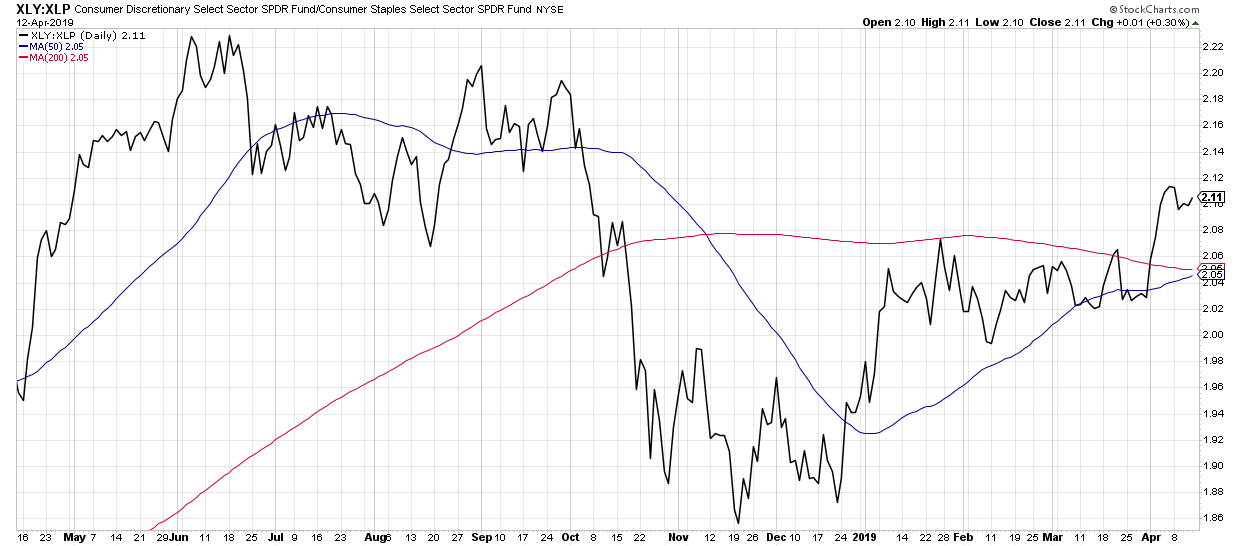
 2. Offense would need to prevail over defense in the consumer sectors. The Consumer Discretionary vs. Consumer Staples broke to new highs earlier this month. We would need to see further outperformance by the traditional offense in the space.
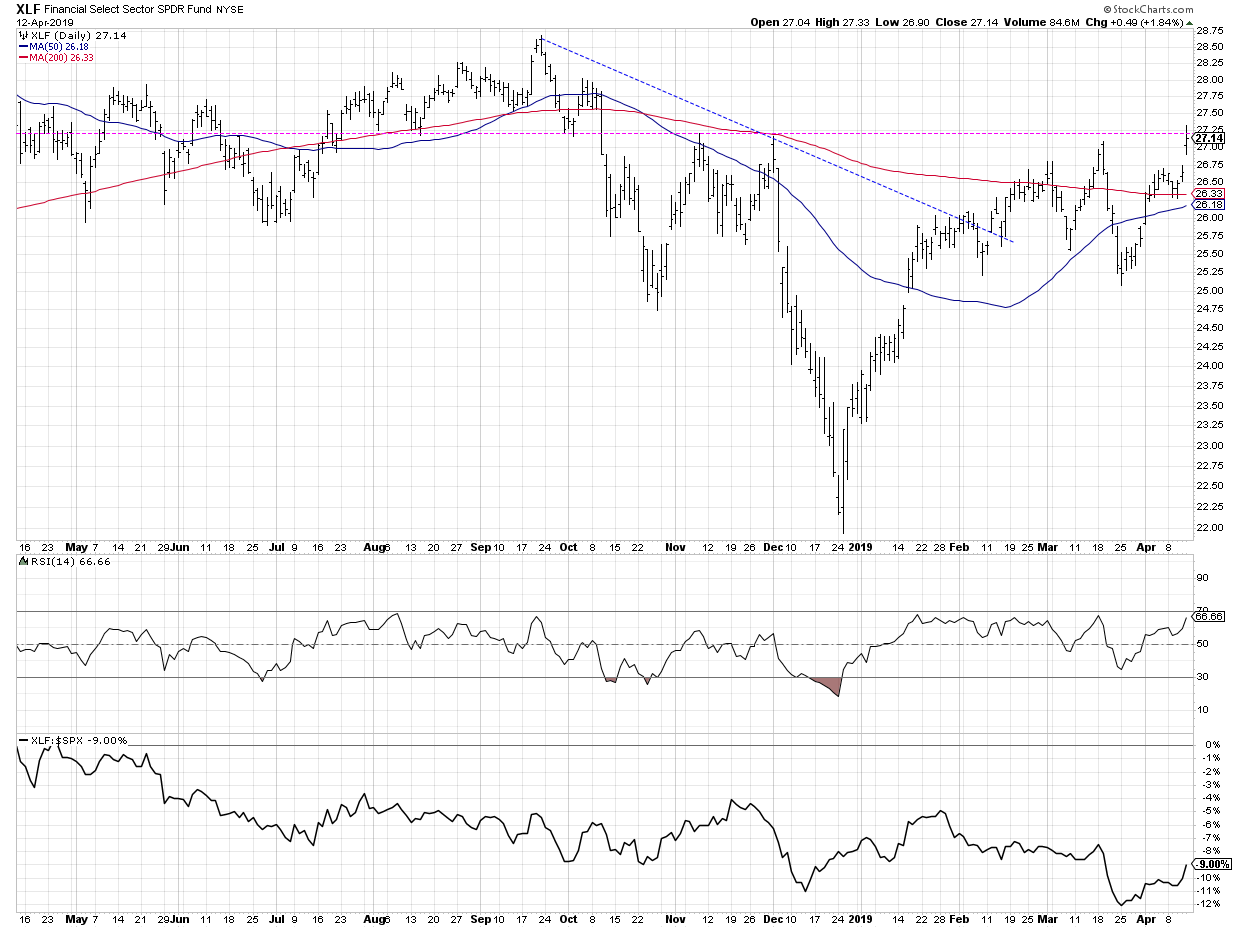
 3. Financials would need to join in the bullish party. The big banks are just starting to report earnings; they would have to impress to move these charts to more bullish configurations.
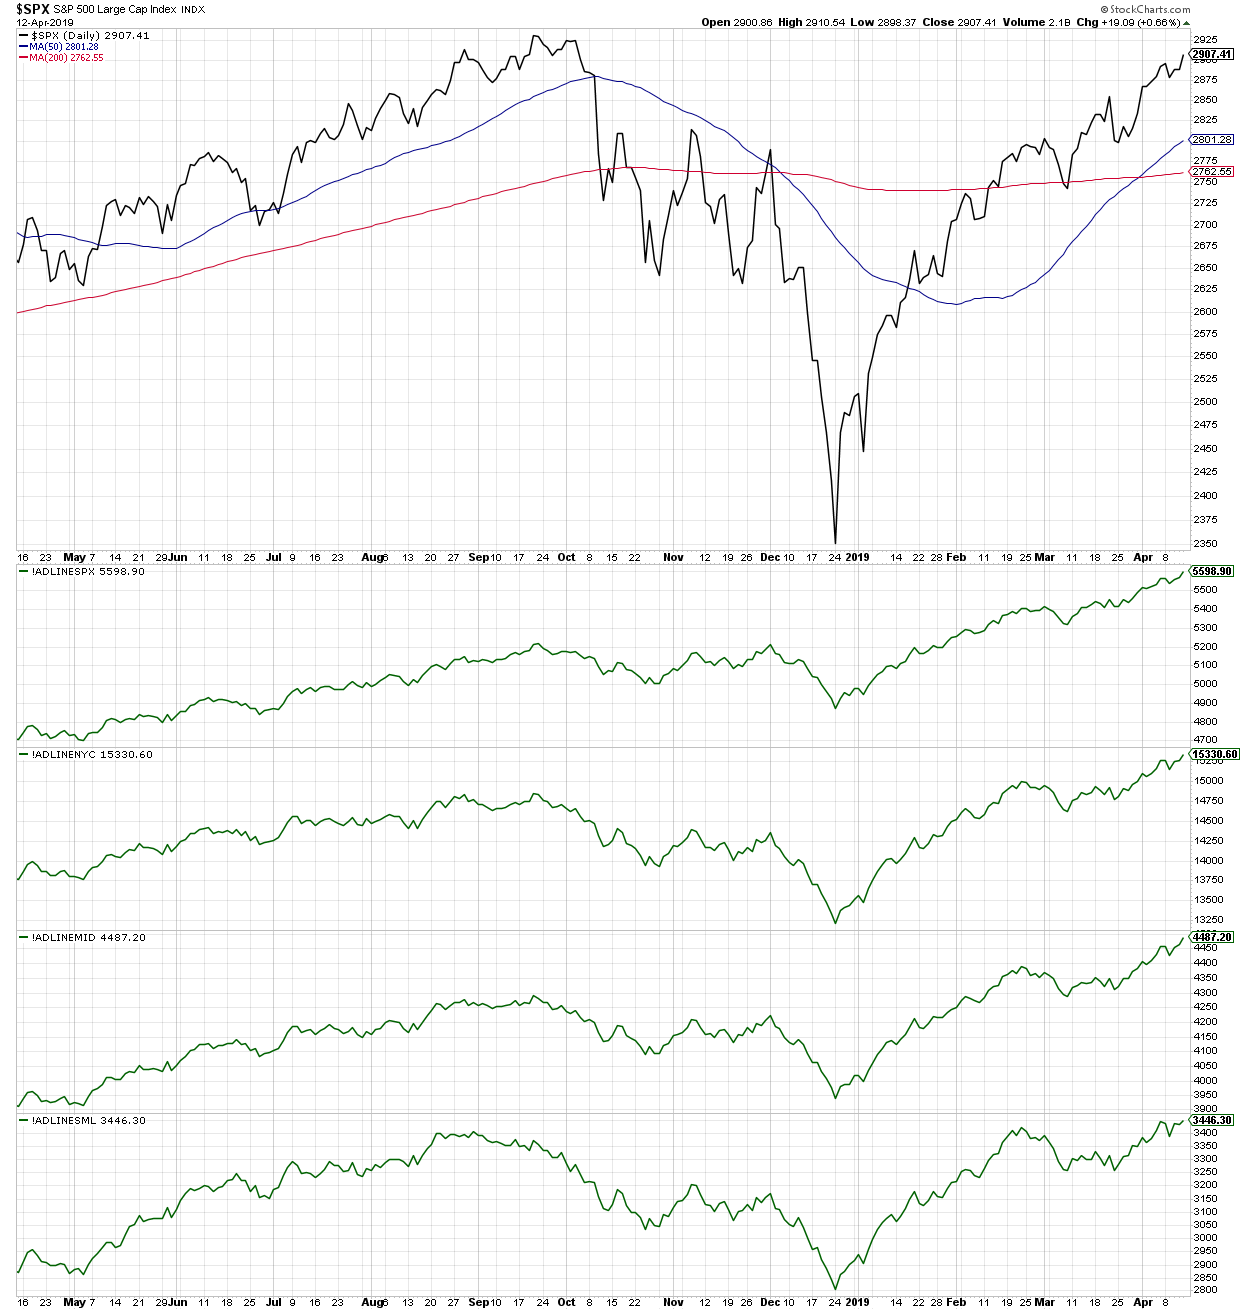
 4. Breadth would need to remain positive across the board. I wrote earlier about the breadth in mid and small cap names vs. large caps. At this point, all cap tiers have seen positive breadth into the weekend. Those trends would need to remain higher.
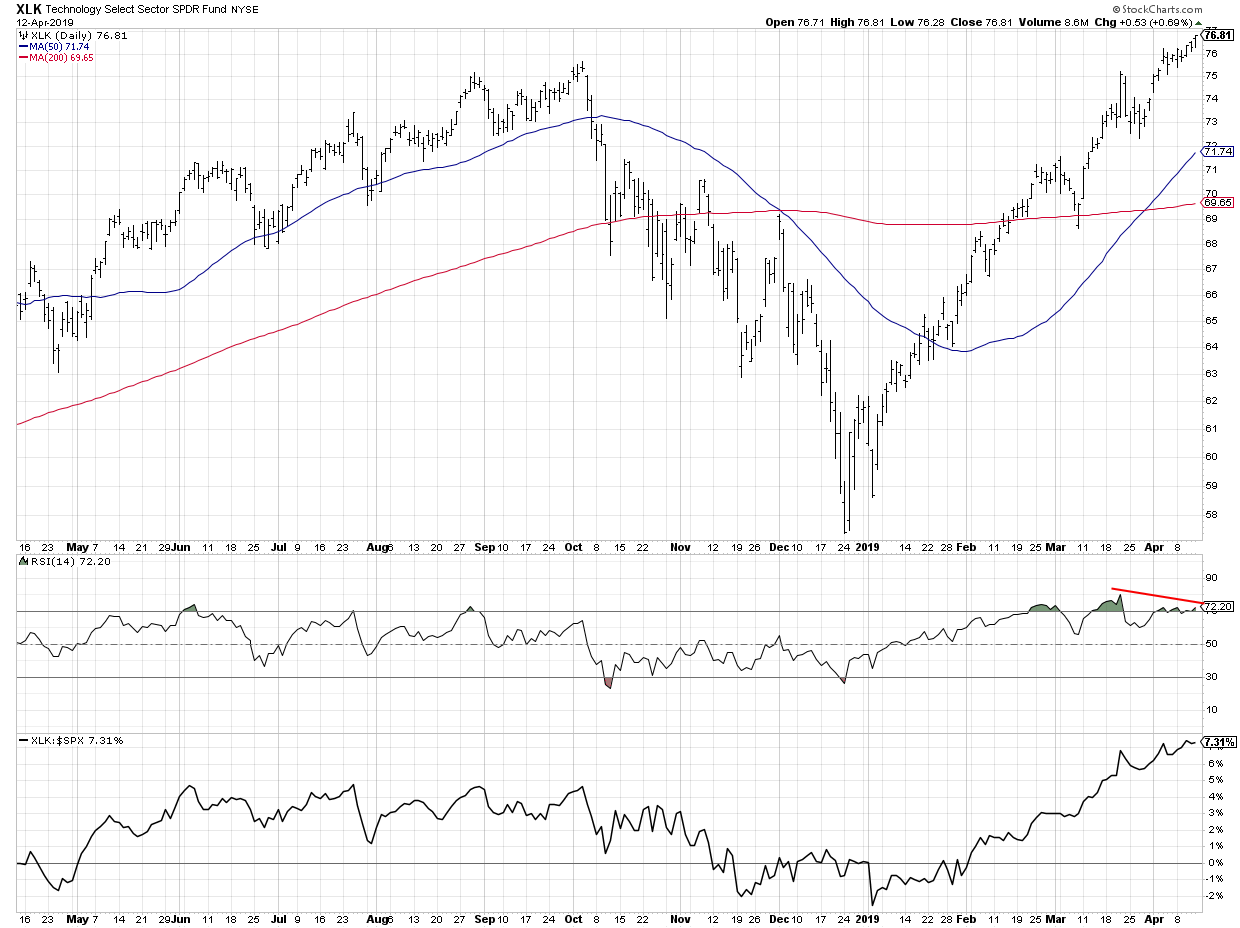
 5. Bearish divergences would need to completely blow out. One of the bullet points in my bearish thesis is the bearish divergence for lots of technology names as they test all-time highs. Those signals would need to fail as the XLK moves further up.
 6. The equity markets would need to ignore traditional seasonal tendencies. We’re soon entering the seasonally weakest part of the year. Equities would need to ignore that pattern or at least have a limited drawdown before continuing the uptrend.
So are all six of those points possible? Absolutely. Are they likely? I honestly don’t think so. But by going through this exercise, I now have a checklist of things to watch for which would confirm that the “ultra-bullish” thesis is starting to play out. If the market begins to achieve these bullish objectives, I may have to mentally prepare for much further upside in stocks.
Take a look at your current positions. Play devil’s advocate on one of those stocks. What would you need to see to validate the opposite case and invalidate your current position?
RR#6,
Dave
David Keller, CMT
President, Sierra Alpha Research LLC
Disclaimer: This blog is for educational purposes only and should not be construed as financial advice. The ideas and strategies should never be used without first assessing your own personal and financial situation, or without consulting a financial professional.
The author does not have a position in mentioned securities at the time of publication. Any opinions expressed herein are solely those of the author, and do not in any way represent the views or opinions of any other person or entity.