The SCTR ranking tool is one of my favorite tools on StockCharts. Exclusive to the website, it is a very powerful indicator that provides what is effectively a sports ranking system for stocks, keeping track of what is outperforming right now. On the Wednesday and Friday editions of Market Buzz, I covered how to use the SCTR to find nice setups.
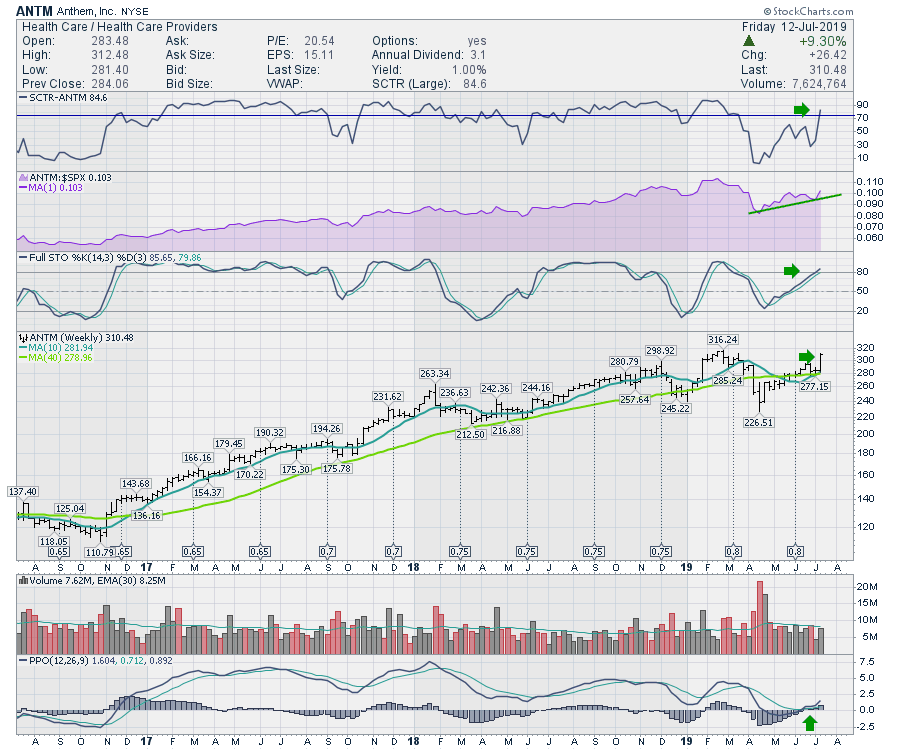
This Anthem, Inc. (ANTM) chart looks excellent on the weekly. You can see that the chart has been accelerating to the upside; the SCTR has resumed its strength by moving back above the 75 level. After the pullback in the spring, this chart looks ready to again accelerate to the upside.
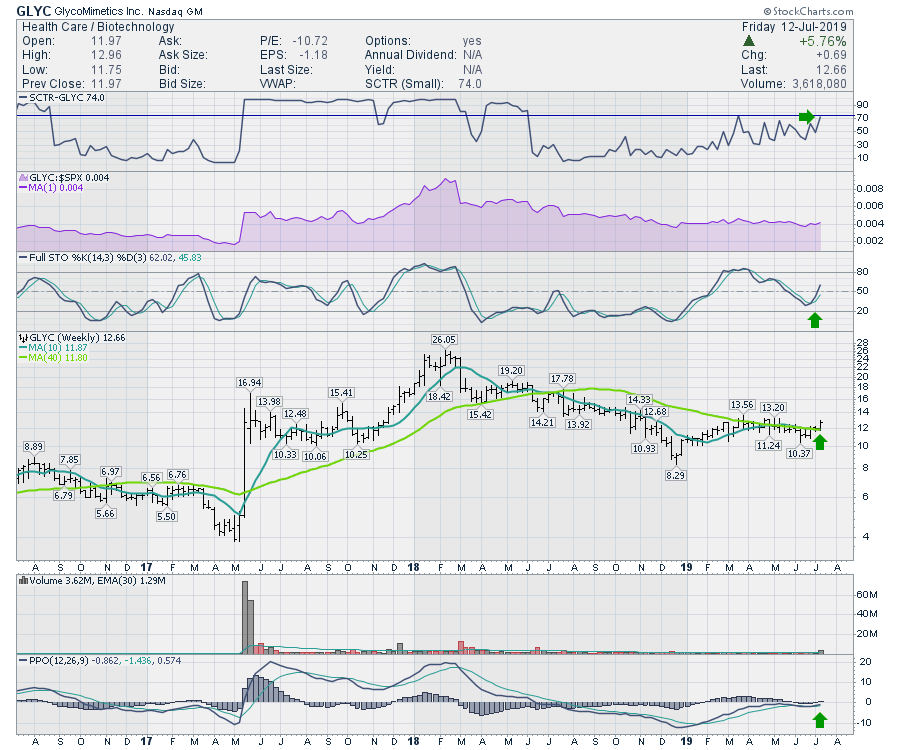
 Technical Analysts always use stops to control their losses, but the main idea is to trade setups that repeat over and over. The chart below shows a stock that surged on major optimism, then pulled back. It looks like the stock is starting to build a setup for the next breakout. This week shows the stock starting to move to new highs, but all the momentum indicators are also in the right place to start firing off buy signals. While we don't know the future, we typically see stocks set up similar patterns that start to go on a run become very successful. GlycoMimetics (GLYC) has an attractive SCTR ranking which is continually climbing. The PPO is just turning up around zero and the stock is breaking above both the 40-week and 10-week moving averages.
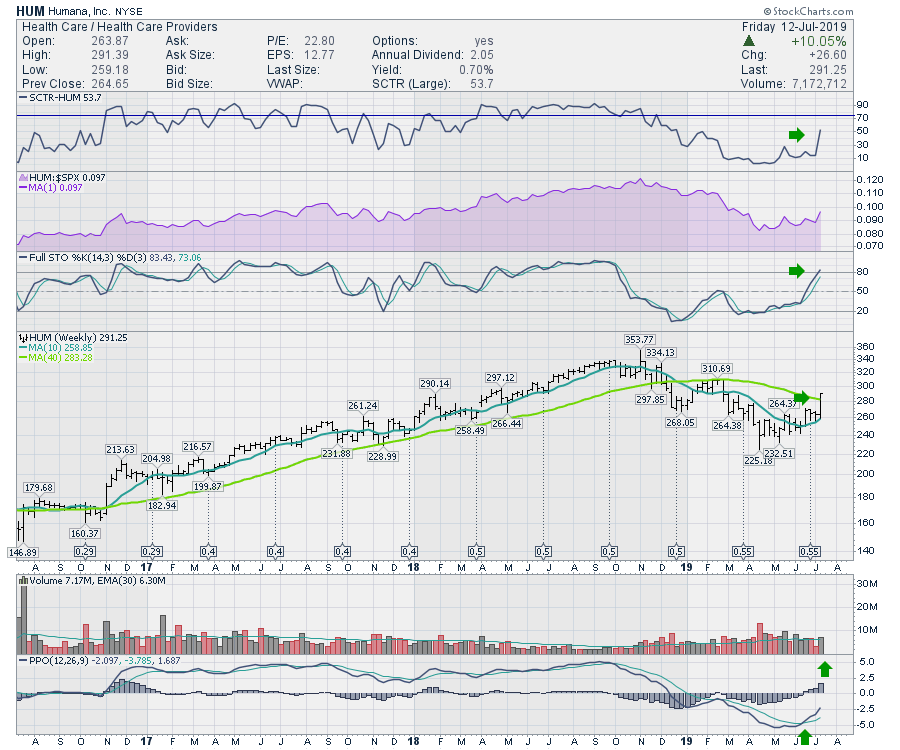
 Humana is also starting to move. Once again, the SCTR is showing a different setup, but this is one that can be profitable as well when tied in with other indicators.
 For more information on how to use the SCTR for your trading, check out the Market Buzz shows from Wednesday and Friday. All the Market Buzz shows can be found through this link.
Good trading,
Greg Schnell, CMT, MFTA
Senior Technical Analyst, StockCharts.com
Author, Stock Charts For Dummies
Want to stay on top of the market's latest intermarket signals?
– Follow @SchnellInvestor on Twitter
– Connect with Greg on LinkedIn
– Subscribe to The Canadian Technician
