I want to discuss two charts that really need to be monitored closely as we enter the second half of 2019. A rise in these charts is synonymous with massive bull market rallies. They both make great common sense, so let's discuss them before visualizing the charts.
1. 10 Year Treasury Yield ($TNX)
One very important lesson to understand about the stock market is that money comes from two places. One rather obvious source is new money entering the stock market. A simple example is deciding to use cash to buy a stock. The stock market goes higher based on more demand than supply. It goes down because of the opposite. Any signs of economic improvement will typically see money rotate from defensive investments to more aggressive investments.
Big investment firms use asset allocation strategies. When they believe our economy is strengthening, they will look to change their allocation model, normally raising the percentage allocated to stocks and lowering the percentage allocated to fixed income like the TNX. Here's a chart to illustrate the power of asset class rotation:
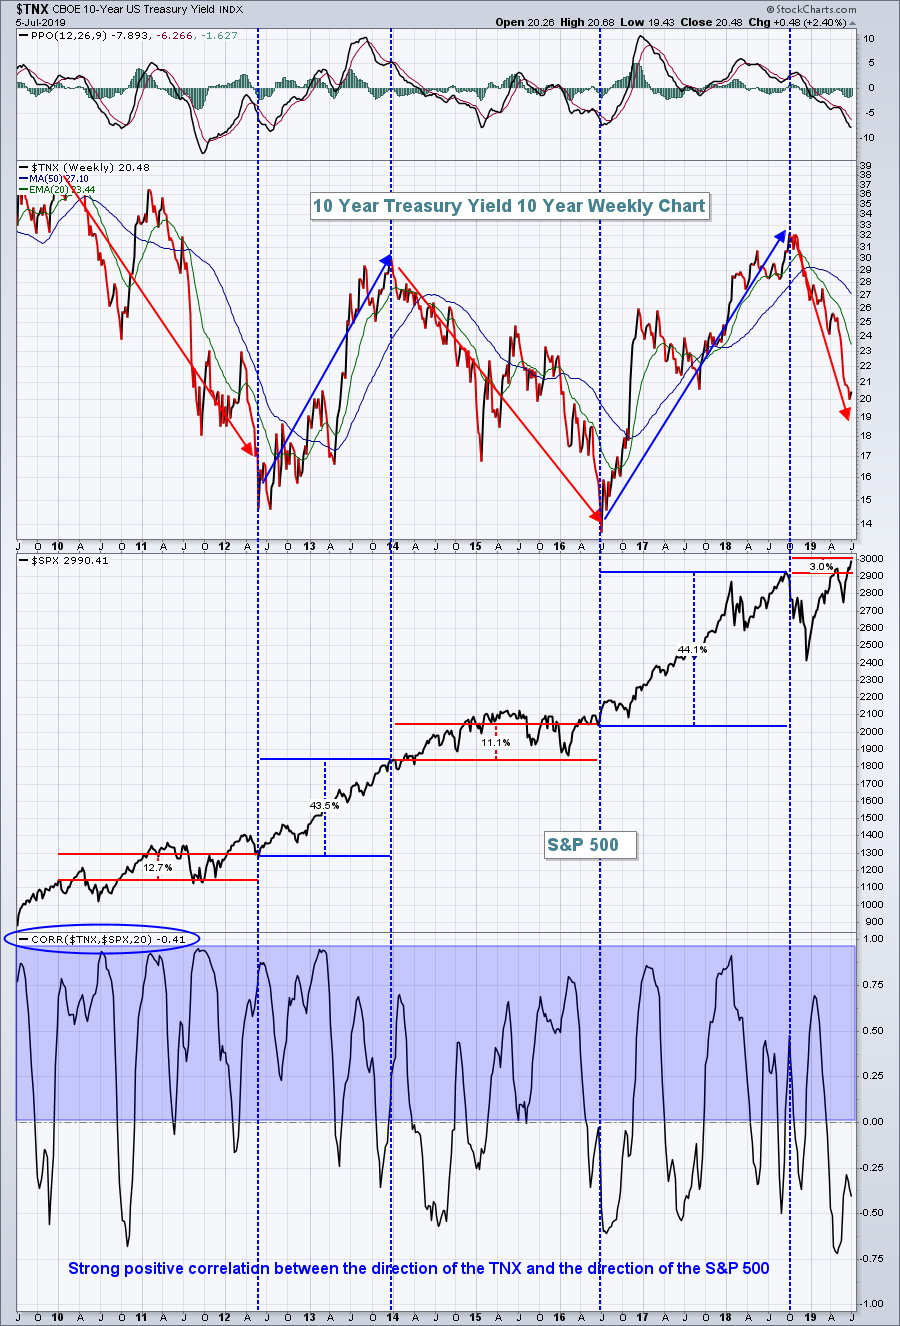 When the TNX is falling, money is rotating into treasuries, and you can see the resulting struggle in the S&P 500. But, when the TNX is rising, money is rotating away from treasuries, and that money typically drives the S&P 500 much, much higher. The last two times the TNX trended higher for extended periods of time, the S&P 500 posted its most impressive uptrends during the current bull market.
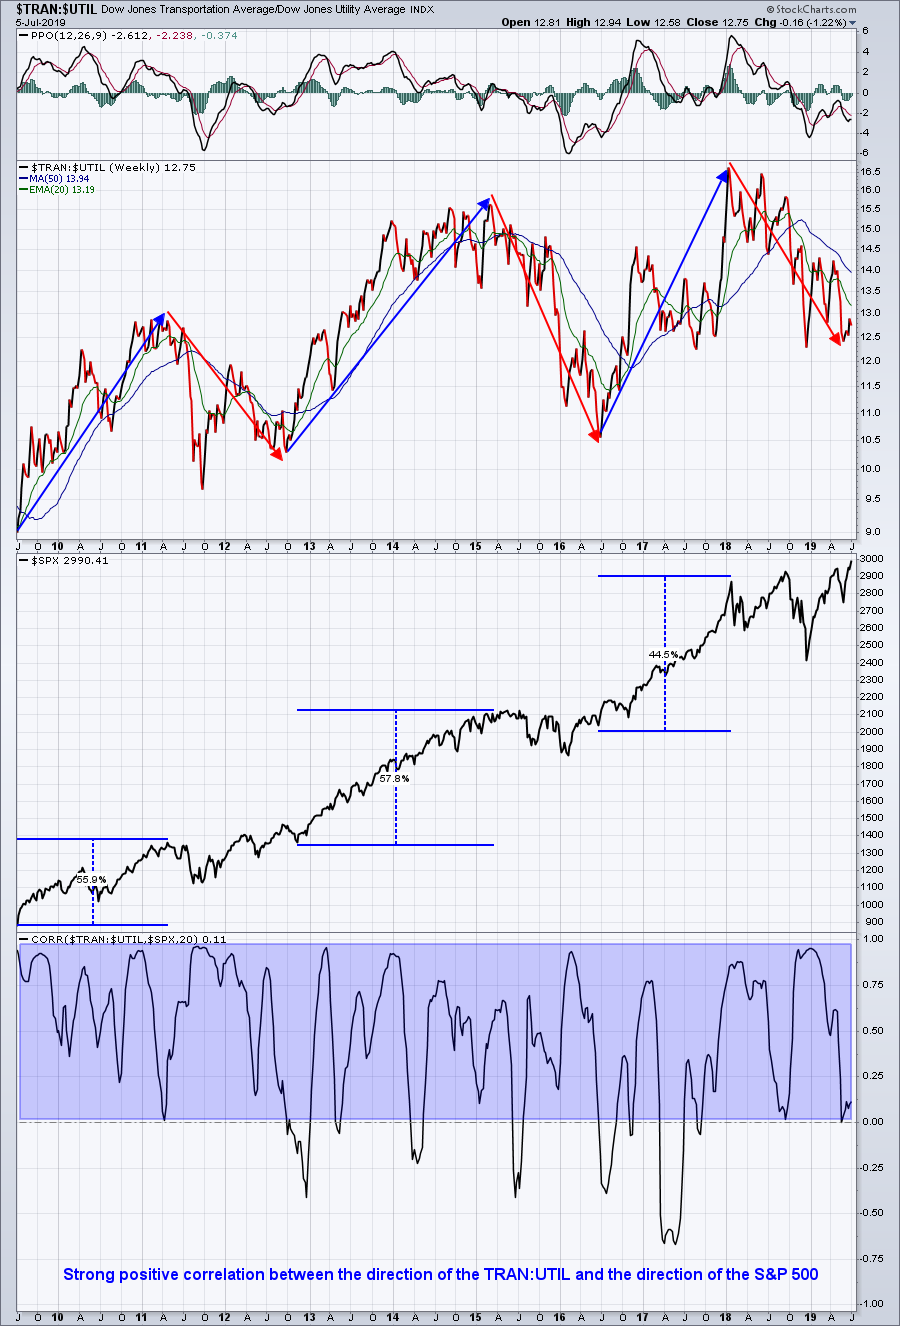
2. Transports ($TRAN) vs. Utilities ($UTIL)
The Dow Jones Transportation Average ($TRAN) should perform well in an improving economic environment, as more goods would be expected to be shipped. Those improving economic conditions generally hurt the Dow Jones Utilities Average ($UTIL) as money rotates away from safety into riskier assets. In addition to money rotating from treasuries to equities, there's also a strong tendency to see money rotate from defensive equity stocks to aggressive equity stocks. When that occurs, the S&P 500 normally gets a sizable boost:
 As you know if you've followed my ChartWatchers articles and my daily Trading Places articles, I remain very bullish on U.S. equities. Central bankers around the globe continue to support equity prices and that should not be overlooked. Global stock markets, with few exceptions and despite negative media attention, remain in multi-year bull markets. These uptrends have occurred despite record amounts of money flowing into global treasuries. Imagine the possibilities of global equities when rotation begins to take place. The above charts demonstrate that, when the TNX chart and TRAN:UTIL ratio chart both move higher, the S&P 500 explodes..... and it explodes for very good reason.
Make sure you follow these two charts. If they fail to move higher, then I suspect the S&P 500's attempt to set new all-time record highs will be challenging. However, if we see bottoms form in these two charts, then we could see an S&P 500 high in the next 1-2 years that approaches 4000 or more.
On Monday, July 8th at 4:30pm EDT, I'll join John Hopkins at EarningsBeats.com for a special "2019 2nd Half Market Outlook" webinar. There are areas where you definitely will want to have exposure and other areas that you'll want to avoid. I'll explain my reasons and discuss how you can not only participate in the upcoming equity surge, but also how you can outperform the benchmark S&P 500 by a wide margin. CLICK HERE to register and for more information.
Happy trading!
Tom
