 Stocks were hit hard in early August with SPY and QQQ falling six to seven percent in six days. These declines started from new highs in late July, which is when these prizefighters were at peak performance. The sharpness of the declines is like a prizefighter getting blindsided and knocked to the floor with a good left hook.
Sellers delivered another left hook on Friday. Why? Because selling pressure was stronger than buying pressure. Yep, that's about the only thing we need to know. Forget the blame game (Fed, Powell, tweets, tariffs, economy or whatever). Everything we need to know is reflected in price action.
Stocks were short-term oversold after the first left hook in early August and a volatile trading range unfolded the last few weeks. This is the prizefighter trying to stabilize after the knockdown. He/She got up on his/her knees and perhaps even got one foot on the ground, but could only get halfway up. The same for SPY and QQQ. They managed to stabilize and recover around half of their prior losses, but could not maintain these gains and fell sharply on Friday. The prizefighters are back on the canvas.
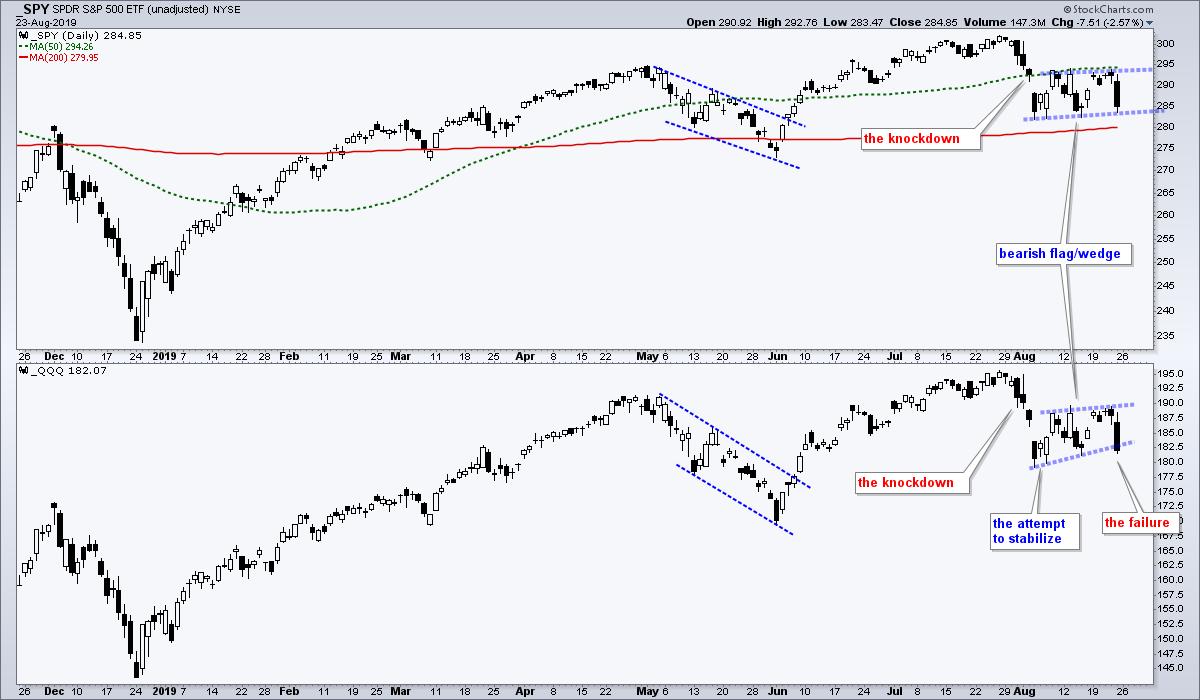
As far as patterns are concerned, SPY and QQQ formed rising flag/wedges, which are short-term bearish continuation patterns. SPY failed at its 50-day simple moving average and early August highs with a 2.57% decline on Friday. Given this decline, I would expect a flag break and continuation lower. This also implies a break below the 200-day SMA in the near future. QQQ also failed with a sharp decline and broke the wedge line on Friday. This also signals a continuation lower.
------------------------------------------------------------
This Week on Art's Charts
Subscribe to Art's Chart using notification box at bottom of this commentary.
State of the Stock Market - Meet Mr. Split - Index Breadth and Sector Breadth Model Updates, analysis for SPY and daily AD Percent, and the Bottom Line.
Technology Could Hold the Key Going Forward - Charting the leading ETF groups (bonds, defensives, gold and low volatility), as well as a list of the laggards.
Measuring Risk On/Off with Stocks, Treasuries, Junk Bonds, Low Volatility and High Beta - Junk bonds are seriously underperforming Treasuries and high beta stocks are underperforming low volatility stocks.
Bonds, Gold, the PPO and Stretched Conditions - TLT and GLD are on a tear, but are stretched by one key metric and could be ripe for a correction in the coming weeks.
Choose a Strategy, Develop a Plan and Follow a Process
Arthur Hill, CMT
Chief Technical Strategist, TrendInvestorPro.com
Author, Define the Trend and Trade the Trend
Want to stay up to date with Arthur's latest market insights?
– Follow @ArthurHill on Twitter
– Subscribe to Art's Charts
