
Major bullish reversal patterns signal the start of new up trends that can extend and be very profitable. However, chartists must first learn to distinguish between meaningful patterns and irrelevant patterns. Here's how...
There are three parts to a major bullish reversal pattern. First, there is the price action leading into the pattern, which is a downtrend. Second, there is the pattern itself, which is the base-building process. Third, there is the price action leading out of the pattern, which is the breakout. All three parts are important and there are four keys successful identification.
First, a pre-existing downtrend is mandatory. This may sound obvious, but you cannot have a major bullish reversal pattern without a substantial downtrend to reverse. The decline into the pattern should be extended, in duration and distance. A three week decline that extends 7% will not cut it.
Second, the height of the base should be in proportion to the prior decline. While there are no hard and fast rules, the height of the pattern should not cover more than half of the prior decline. If a stock declines from 80 to 40, a Double Bottom should not extend past 60. Otherwise, the Double Bottom covers more than half the decline and we should consider alternatives.
Third, the base of the pattern should extend for months, not weeks. The base represents the accumulation phase when the "smart" money buys. The longer the base, the longer the accumulation phase and the more solid the base from which to launch a breakout. A three-week base does not cut it.
And finally, the breakout should be strong and confirmed with other indicators. Price should accelerate to the upside and break above resistance like a hot knife through butter. Chartists can use volume, volume-based indicators or other trend indicators to confirm the breakout. This is a fielder's choice.
Now let's look at some examples.
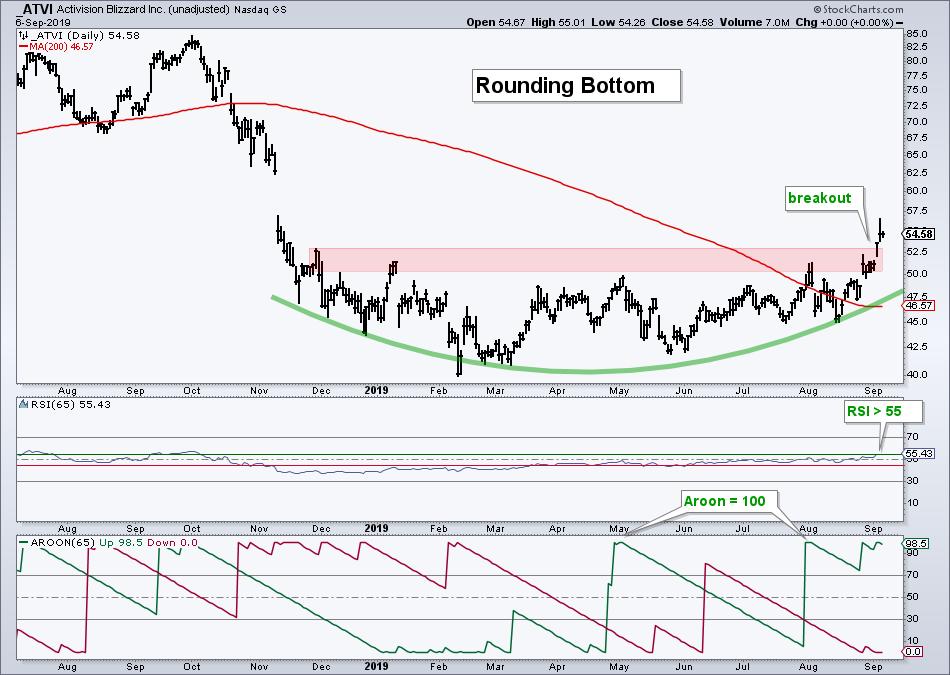
The example above shows Activision Blizzard (ATVI) with a Rounding Bottom that checks all four boxes (hat tip @JBorman). First, the stock declined over 50% and hit a 52-week low in February. Second, the height of the pattern (40-52) is less than a third of the prior decline. Third, the base building process extends nine months as the stock formed the Rounding Bottom from December to August. Fourth, the breakout occurred with a price acceleration that is confirmed with the 200-day SMA, RSI(65) and Aroon(65).
Click here for a System Trader article explaining how to use RSI(65) and Aroon(65) to identify uptrends.
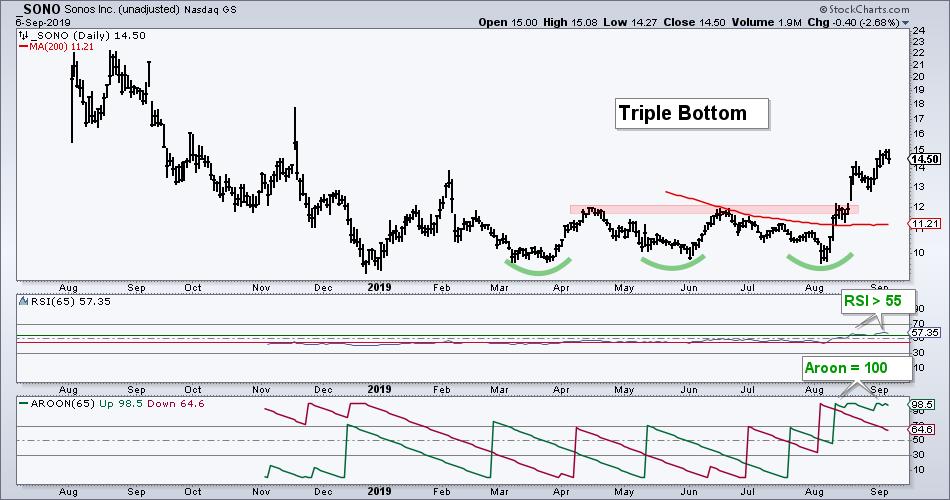
The second example shows Sonos (SONO) with a Triple Bottom that checks all four boxes as well (hat tip @verrone_chris). There was an extended decline into the pattern, the height of the pattern is less than a third of the decline and the base extends at least six months. The breakout occurred with a price acceleration and was confirmed with the indicators.
Meaningful bullish reversals patterns are the exception, not the norm. Chartists looking to profit from these patterns must learn to separate the contenders from the pretenders. Ignore the pretenders and move on. Put the contenders are on your watch list and act when your setup triggers.
------------------------------------------------------------
This Week on Art's Charts
SOXX extends bounce off key retracement, IPAY holds up well and ranking ETFs by chart performance (Thursday - click here)
Charting and analyzing the AD Lines, Up/Down Volume Lines and High-Low Lines for the S&P 500, S&P Mid-Cap 400 and S&P Small-Cap 600 (Thursday - click here)
Trading range extends, large-cap breadth holds up, low volatility leads high beta and junk bonds show little fear (Wednesday - click here)
A classic reversal pattern in a digital storage leader - Plus four other setups (Wednesday - Click here)
QQQ and SPY are doing just fine as XLY and XLK carry the load in August (Tuesday - click here)
-----------------------------------------------------------
Choose a Strategy, Develop a Plan and Follow a Process
Arthur Hill, CMT
Chief Technical Strategist, TrendInvestorPro.com
Author, Define the Trend and Trade the Trend
Want to stay up to date with Arthur's latest market insights?
– Follow @ArthurHill on Twitter
– Subscribe to Art's Charts
